How to add and configure the Gantt view
- 05 Mar 2024
- 4 Minutes to read
- Print
- DarkLight
- PDF
How to add and configure the Gantt view
- Updated on 05 Mar 2024
- 4 Minutes to read
- Print
- DarkLight
- PDF
Article Summary
Share feedback
Thanks for sharing your feedback!
All paid plans | |
| |
Platform(s) | Web/Browser, Mac app, and Windows app |
What is a Gantt chart?
With the Gantt view, you can visualize a schedule of related activities over time — like tasks, projects, or events — on a Gantt chart. You can use it for project management, production timelines, or resource management.
A Gantt chart is a type of horizontal bar chart that uses bars to visualize a schedule of certain activities (tasks, projects, events, resource expenditures, etc.) over time. The length and position of each bar shows the start date, end date, and duration of each activity, and the bars are stacked into rows in such a way that you can easily see at a glance which activities overlap and for how long.
In many cases, a project plan or schedule will require that activities be performed in a certain order (for example, a particular contract needs to be signed before construction can begin). A Gantt chart will let you visualize how different activities depend on each other with arrows (called dependencies) connecting the different bars.
Adding the Gantt view
To add the Gantt view, click on the "View" button near the top-left hand corner of your base. Then select "Gantt" from the list of available view types. Check out this support article for more information on creating new views.
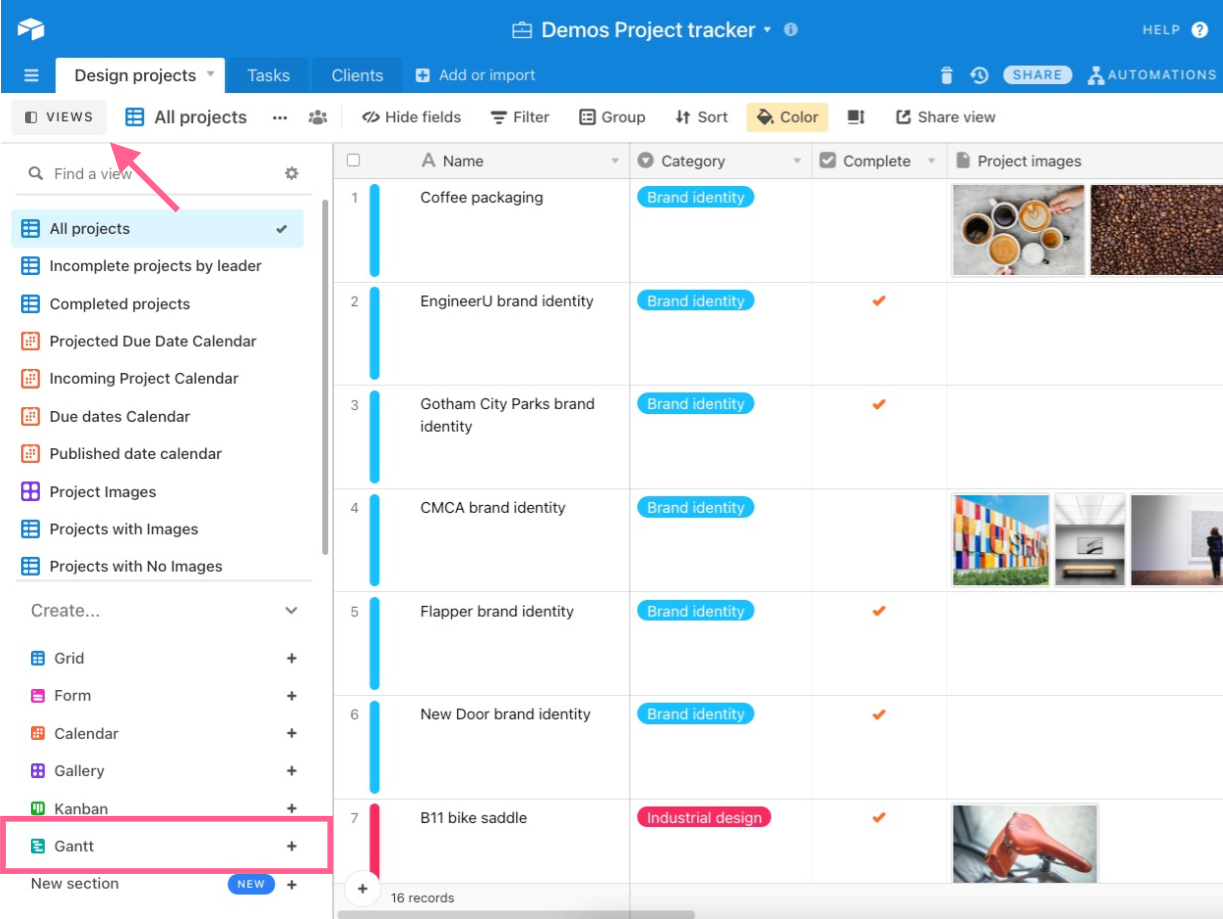
The Gantt view will be created, after which you can configure your data to display in the chart.
Configuring your data
The first group of settings you can configure are data settings, which includes the table and view you want to use for displaying records, and the start and end date fields needed to use the Gantt view. We'll try to automatically fill in these settings for you during the installation, but you may want to adjust them yourself to make sure they reflect the data you want to use.
Start and end dates
The "Start date field" and "End date field" are used to define the duration for each record when it's displayed on the Gantt chart.
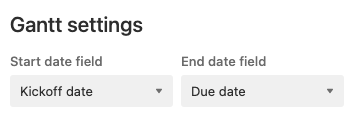
Note
Both of these fields are required to use the Gantt chart; however, you can display records with only an end date by using our milestones feature (detailed further below).
For more information on how Gantt processes certain types of valid dates, see below.
Timestamps
The Gantt view does not account for any timestamps associated with the date fields. If the date fields you're using both have timestamps, the start and end date fields must be set to the same timezone. For example, if you have the Use the same time zone (GMT) for all collaborators option toggled on in the start date field, you must also have it toggled on in the end date field. If only one of the date fields has an associated time, that date field will need to have the Use the same time zone (GMT) for all collaborators option toggled on.
Computed fields
Instead of using date fields, you can also use computed fields that output date values. However, if you use computed fields, you will not be able to manually adjust the start or end dates for your records by dragging the records on the Gantt chart.
Using the same date field for start and end date
You can use the same field for both the start date and the end date if you'd like. Doing this will cause every record on the Gantt chart to appear as a bar with a duration of one day.
End dates
In the Gantt view, end dates are considered to be inclusive. For example, if your start date for a record is January 1 and your end date is January 3, the record will appear as three days long (spanning from the beginning of January 1 to the end of January 3).
Customizing the appearance
There are a couple of appearance options that you'll need to customize while configuring your Gantt view settings for the first time, including row height and the label field.
Row height
You can set the row height to either Medium (the default) or Short, which allows for greater information density. This setting is the second option under "Appearance" in the Gantt view settings.
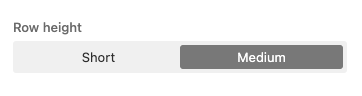
Keep in mind that this is a global setting that is shared across all users, so switching this view setting will change it for all collaborators.
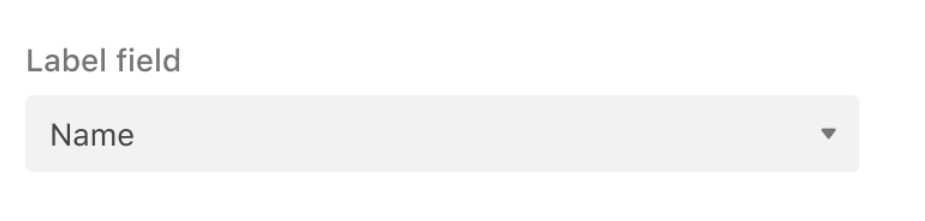
Label
The "Label field" option allows you to choose which field to use as the display name for each record in the view.
Milestones and dependencies
Advanced features are the last category of settings you can configure. These include using milestones and dependencies, which are often new concepts to learn for those who are brand new to using a Gantt chart.
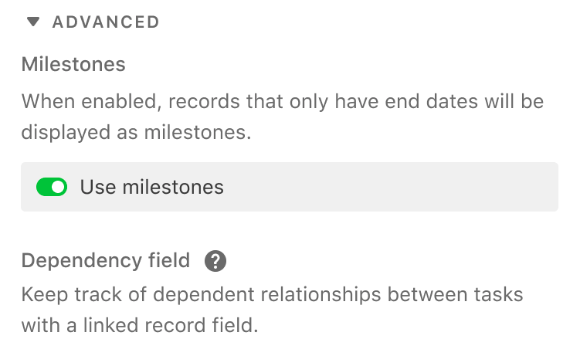
Note
You can learn more about these features in the next article in this series called Gantt view milestones, dependencies, and critical paths.
Printing or downloading Gantt views
Interacting with the Gantt view is a powerful way to manage records. Sometimes it's also helpful to print or download a Gantt chart to view it offline. To download your Gantt chart as a PDF, click the "Export PDF" button.
.gif)
Once you've exported the PDF, it'll appear in the default downloads folder designated by your internet browser or in the preferences for the Airtable desktop app. You can then open this PDF (using your preferred PDF reader application) and print it.
Was this article helpful?