Troubleshooting
If you need help working through an issue, we're here to help.
Find Help →
Billing
Learn how to manage your plans and invoices for self-serve plans.
Read FAQs →
Browse by category


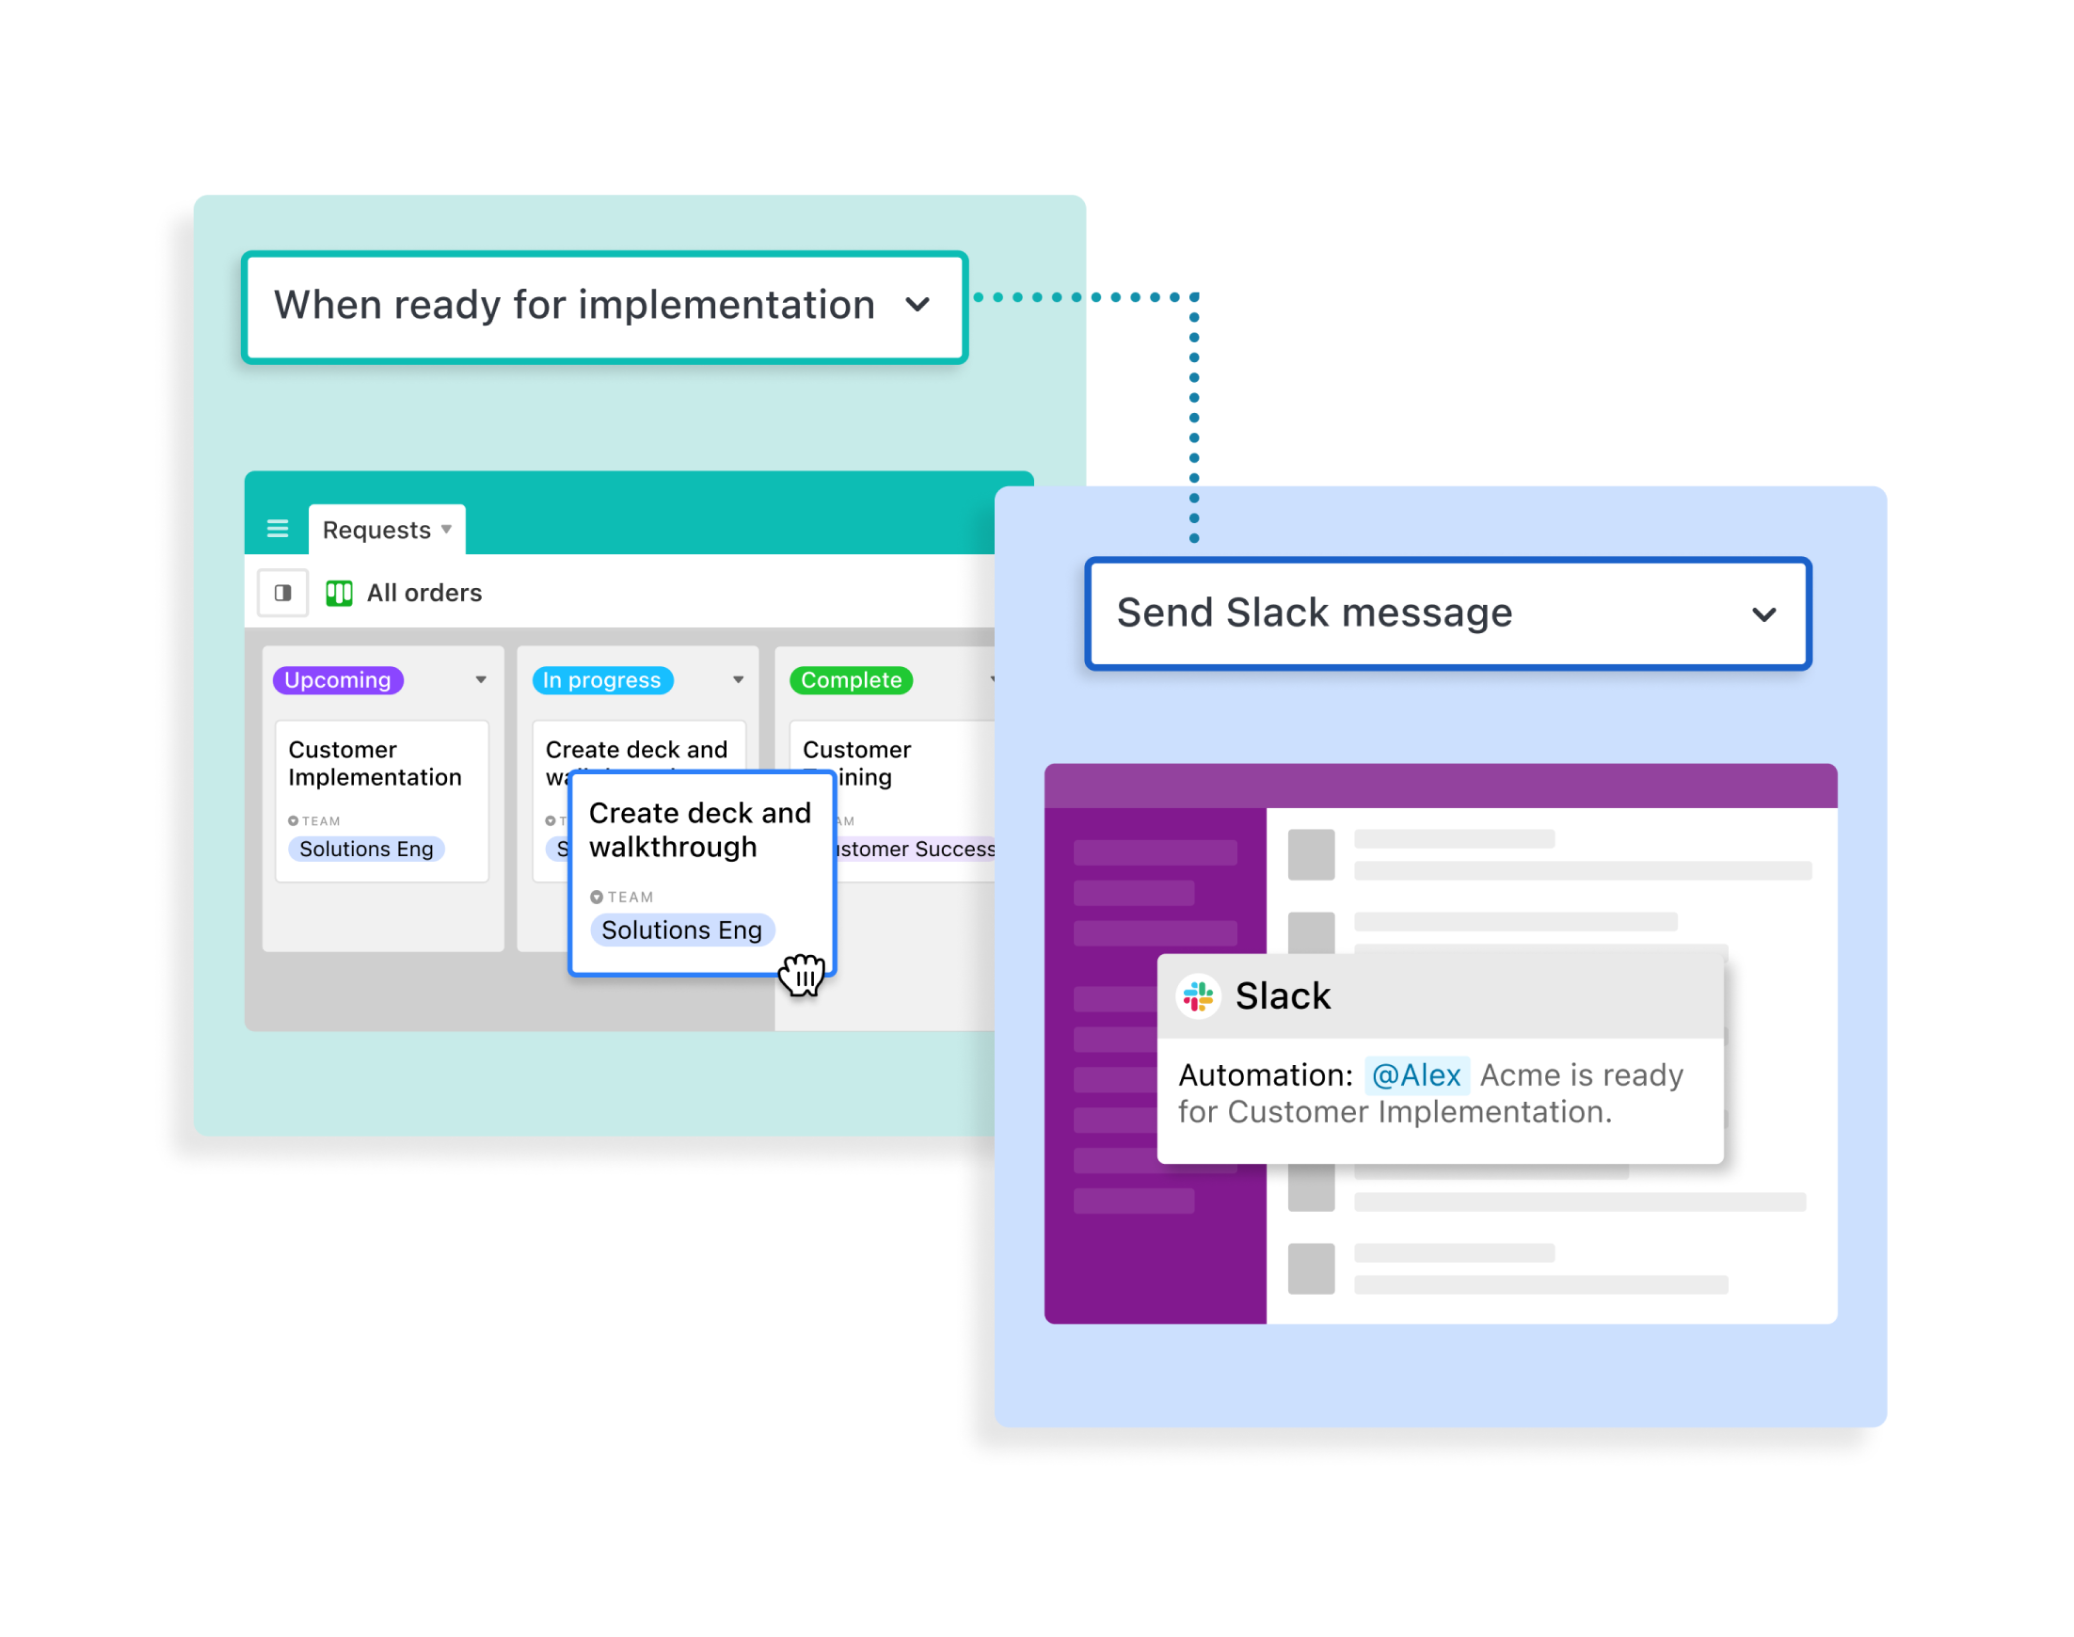
Accelerate work with automations
Automations help work flow quickly and seamlessly, across all your tools and processes. They can trigger notifications, streamline redundant work, integrate your tools, run custom code, and more.
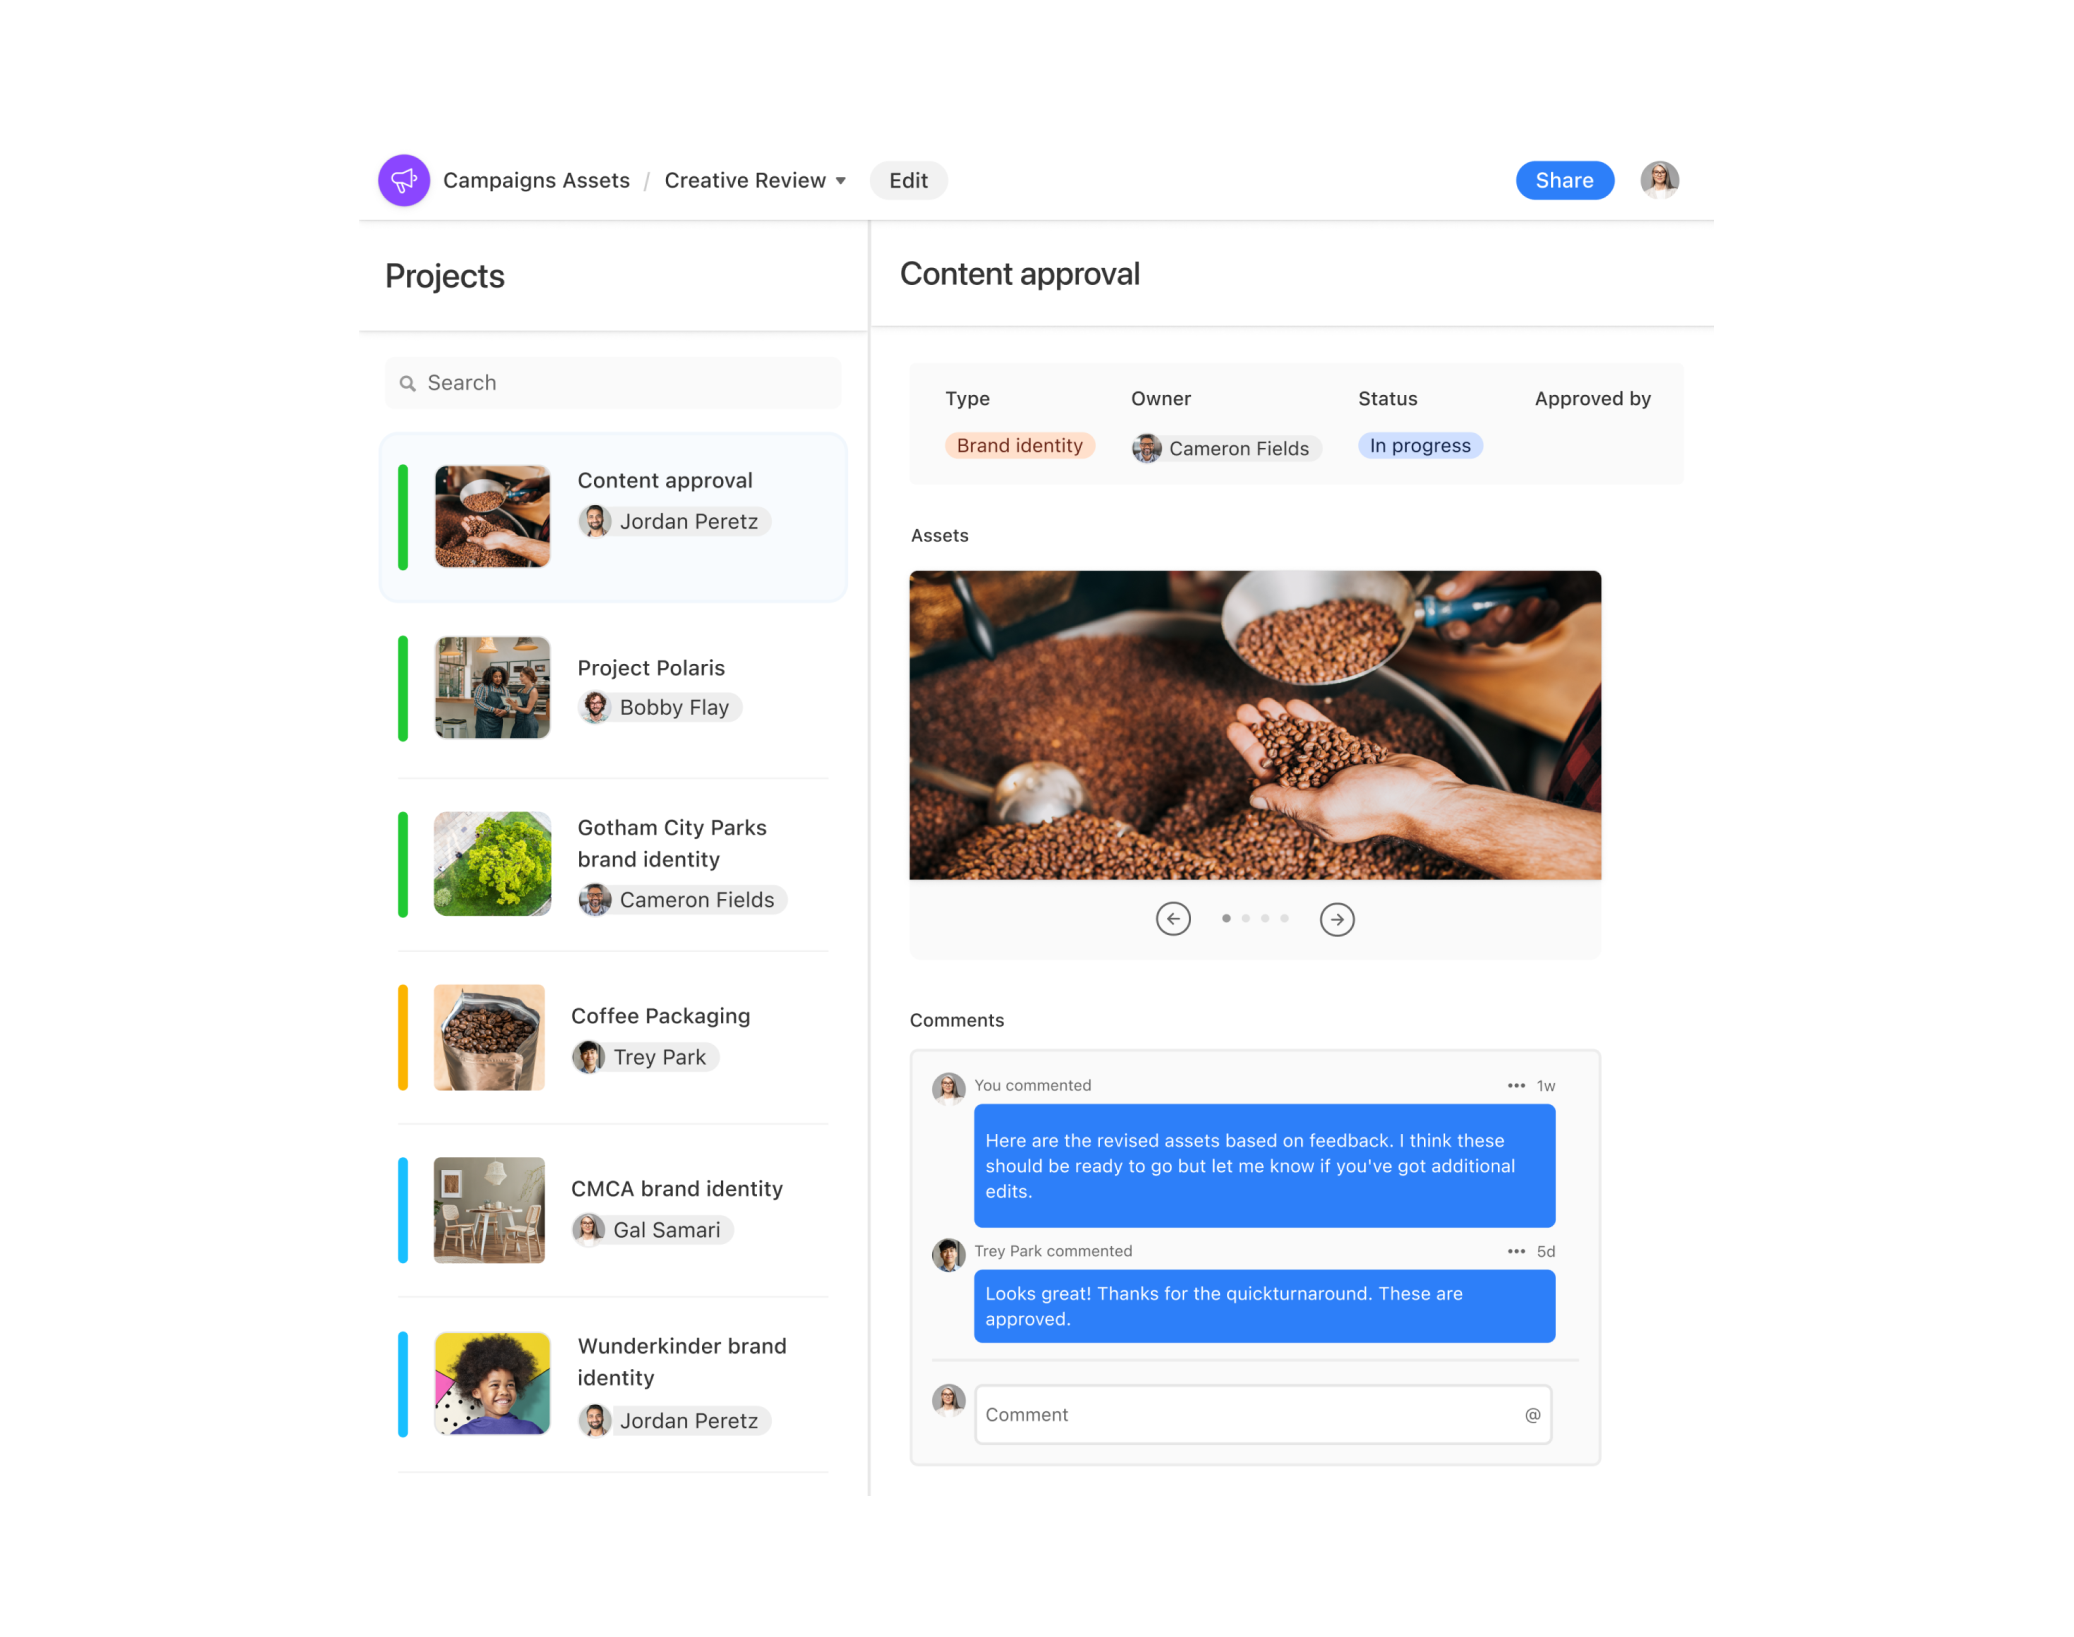
Interface with work in a new way
Create custom interfaces that give each and every teammate the relevant information they need, and a simple way to take action.