If you're looking to get started developing on our platform or to stay up-to-date with news about our platform, we have a number of resources.
Resource | Description |
|---|---|
Follow @AirtableDev on X for the latest developer community news and platform product updates. | |
Stuck on something or wanting to connect with other developers? Check out our developer community forum, which is a space for developers to chat. We also announce regularly announce product updates and feature changes, so be sure to enable notifications! | |
The developer tag on the official Airtable blog contains useful tutorials and tools. You can also learn about product updates and community news, and stay up-to-date on developer events and webinars. | |
Dive into the details of changes to our endpoints and developer solutions by visiting our API documentation. |
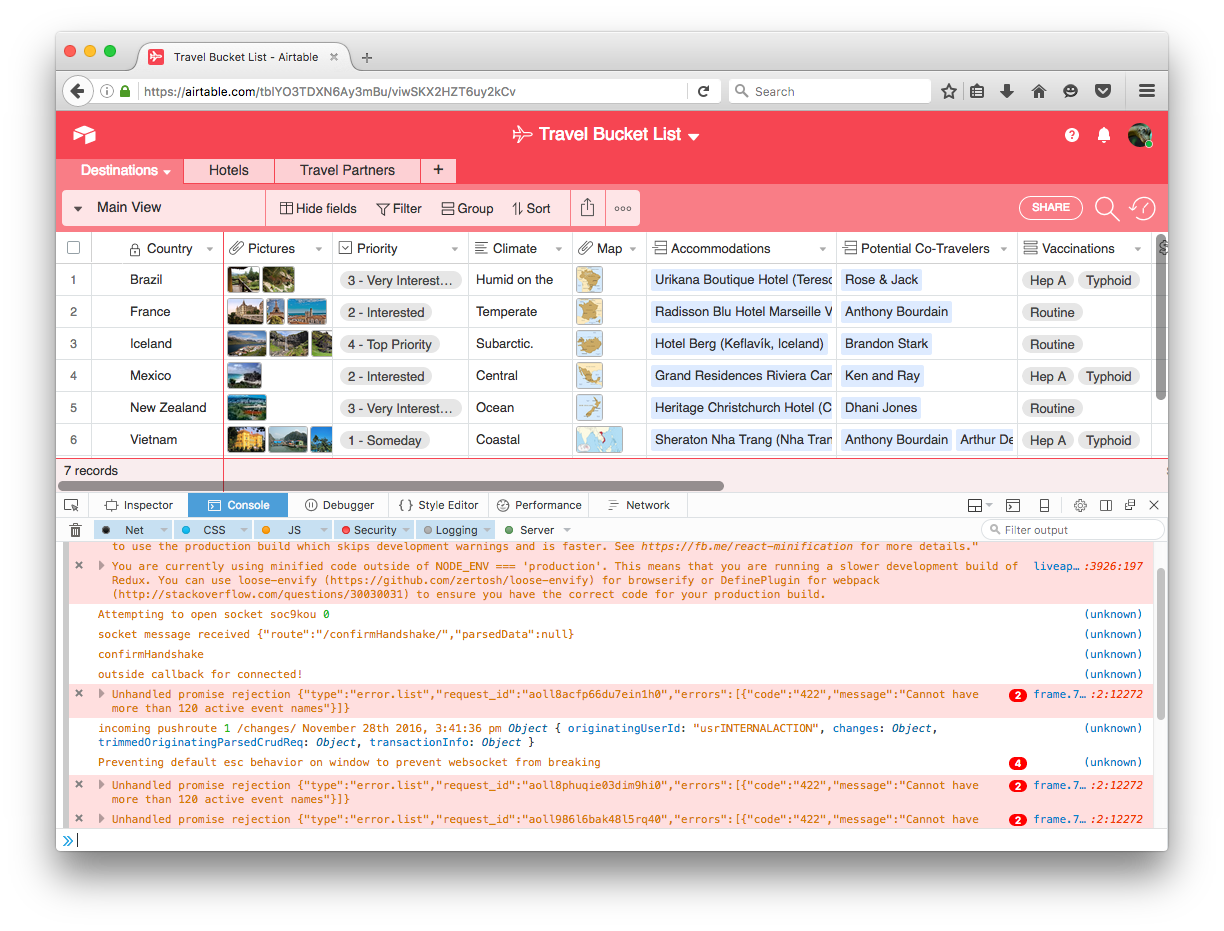
How to open the developer console
The developer console is a tool that logs the information associated with a web page, such as JavaScript, network requests, and security errors. (It does other things, too, but this is all that really matters for this article.)
The information displayed in the developer console can be extremely helpful for the Airtable support team when we're trying to figure out how to solve an issue. In the course of troubleshooting your issue, the Airtable support team may ask you to take a screenshot of the developer console.
The following are instructions for how to open the developer console on various different browsers and Airtable's Mac desktop app.
Chrome
To open the developer console window on Chrome, use the keyboard shortcut Ctrl Shift J (on Windows) or Cmd Option J (on Mac).
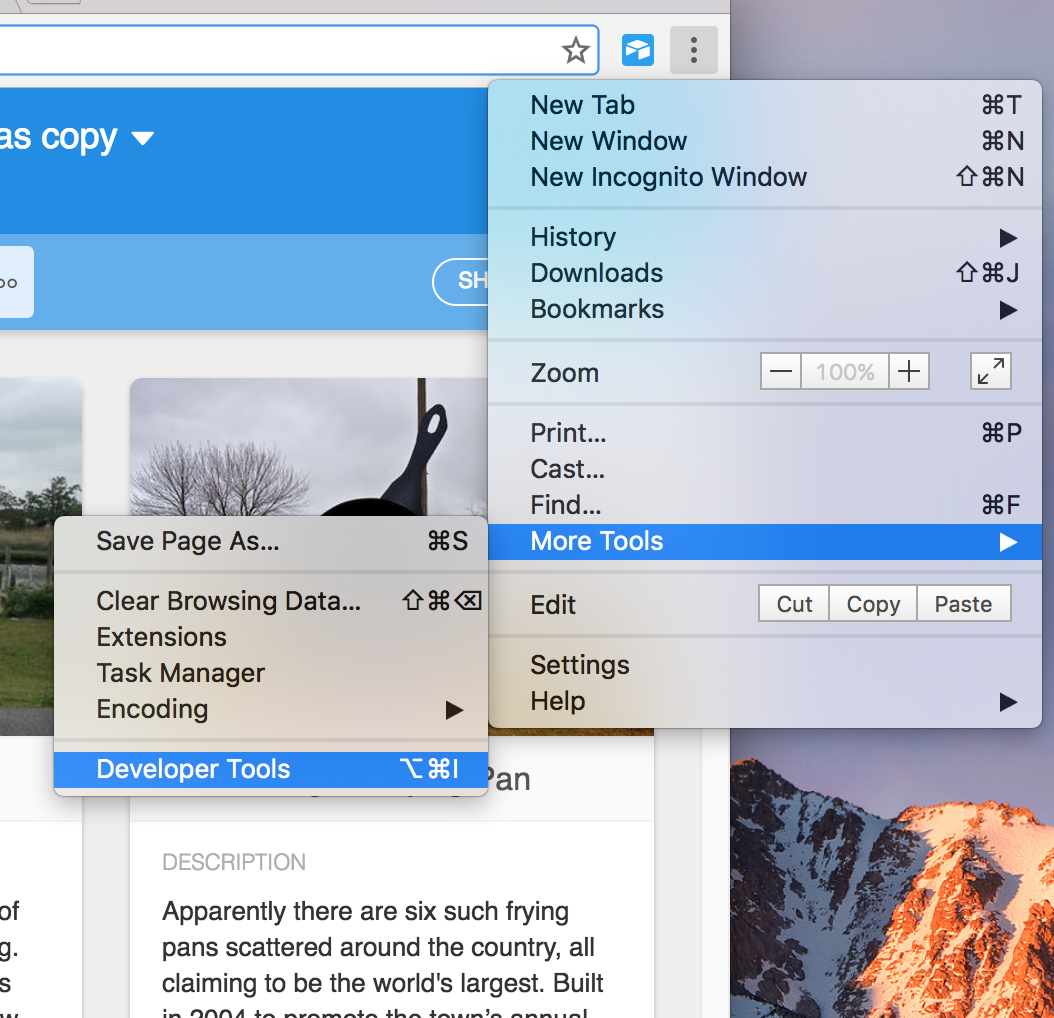
Alternatively, you can use the Chrome menu in the browser window, select the option "More Tools," and then select "Developer Tools."
Edge
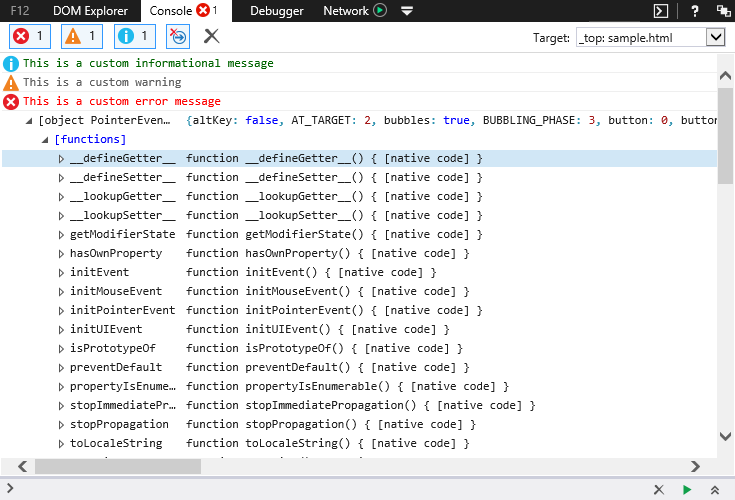
To open the console on Edge, hit F12 to access the F12 Developer Tools. Once in the F12 Developer Tools, navigate to the Console tab.
Firefox
To open the console on Firefox, use the keyboard shortcut Ctrl Shift K (on Windows) or Ctrl Option K (on Mac). The toolbox will appear at the bottom of the browser window, with the Web Console activated.
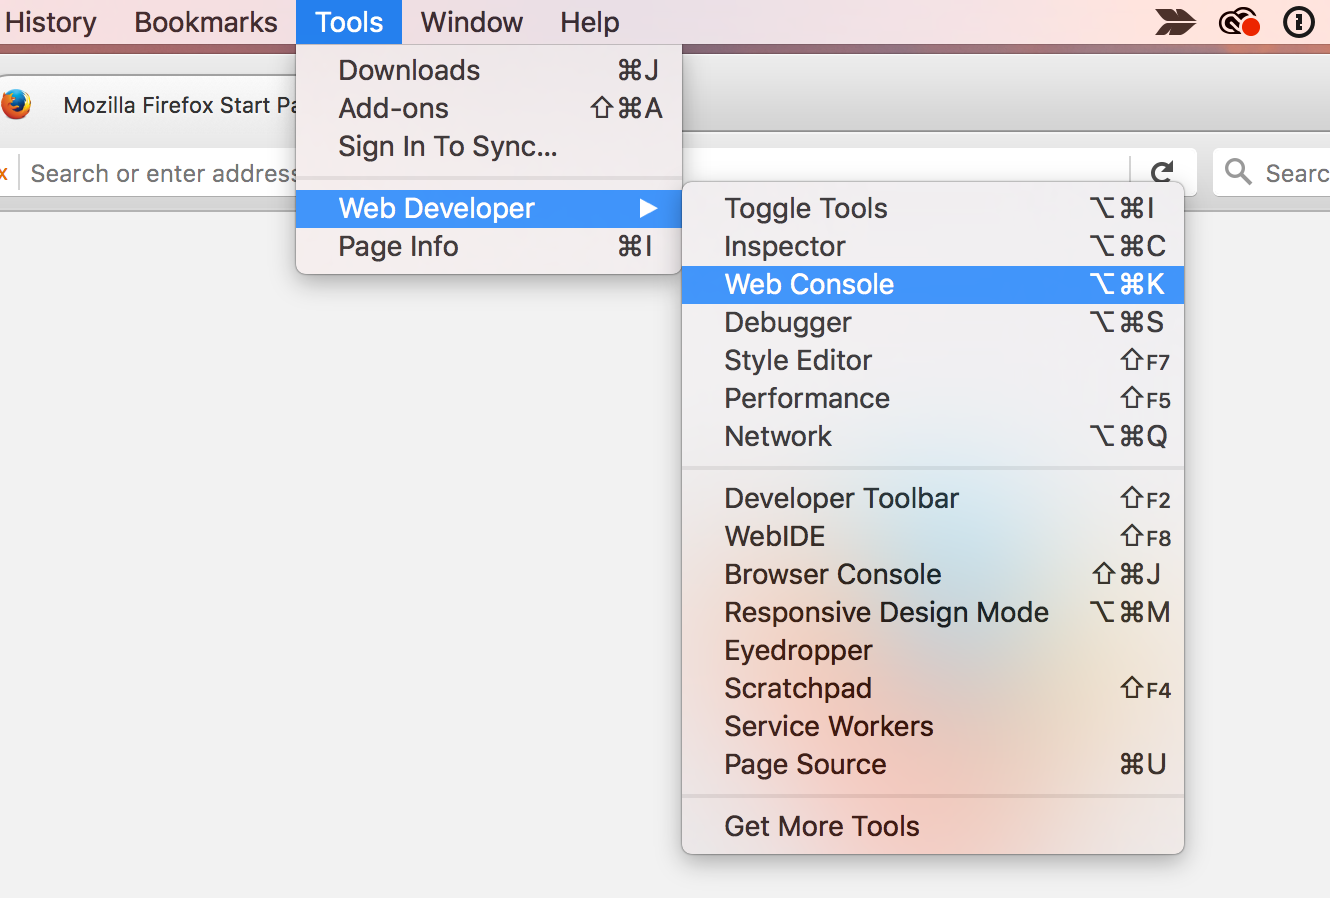
Alternatively, under the header Tools in the Mac menu bar, navigate to the sub-menu Web Developer and select Web Console.
Safari
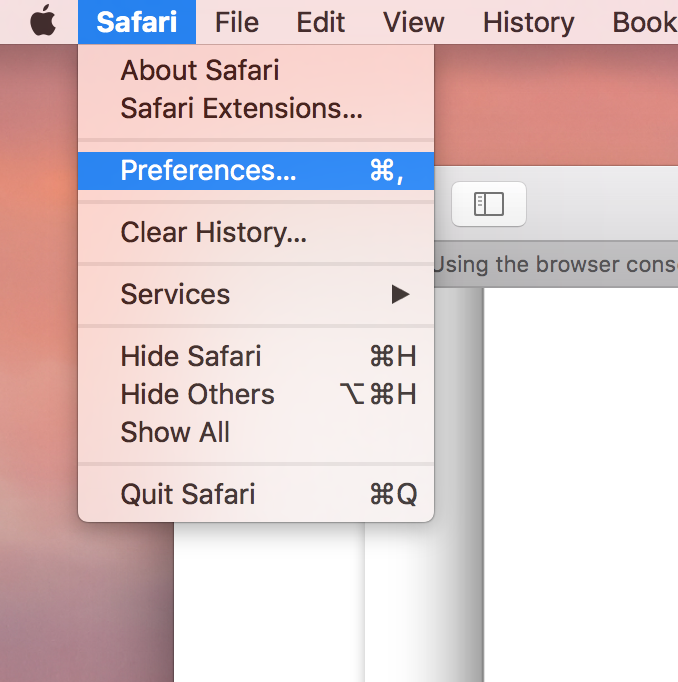
To open the console on Safari, you will first need to turn on the Develop menu. To do this, open the Safari menu in the Mac menu bar, then select Preferences.
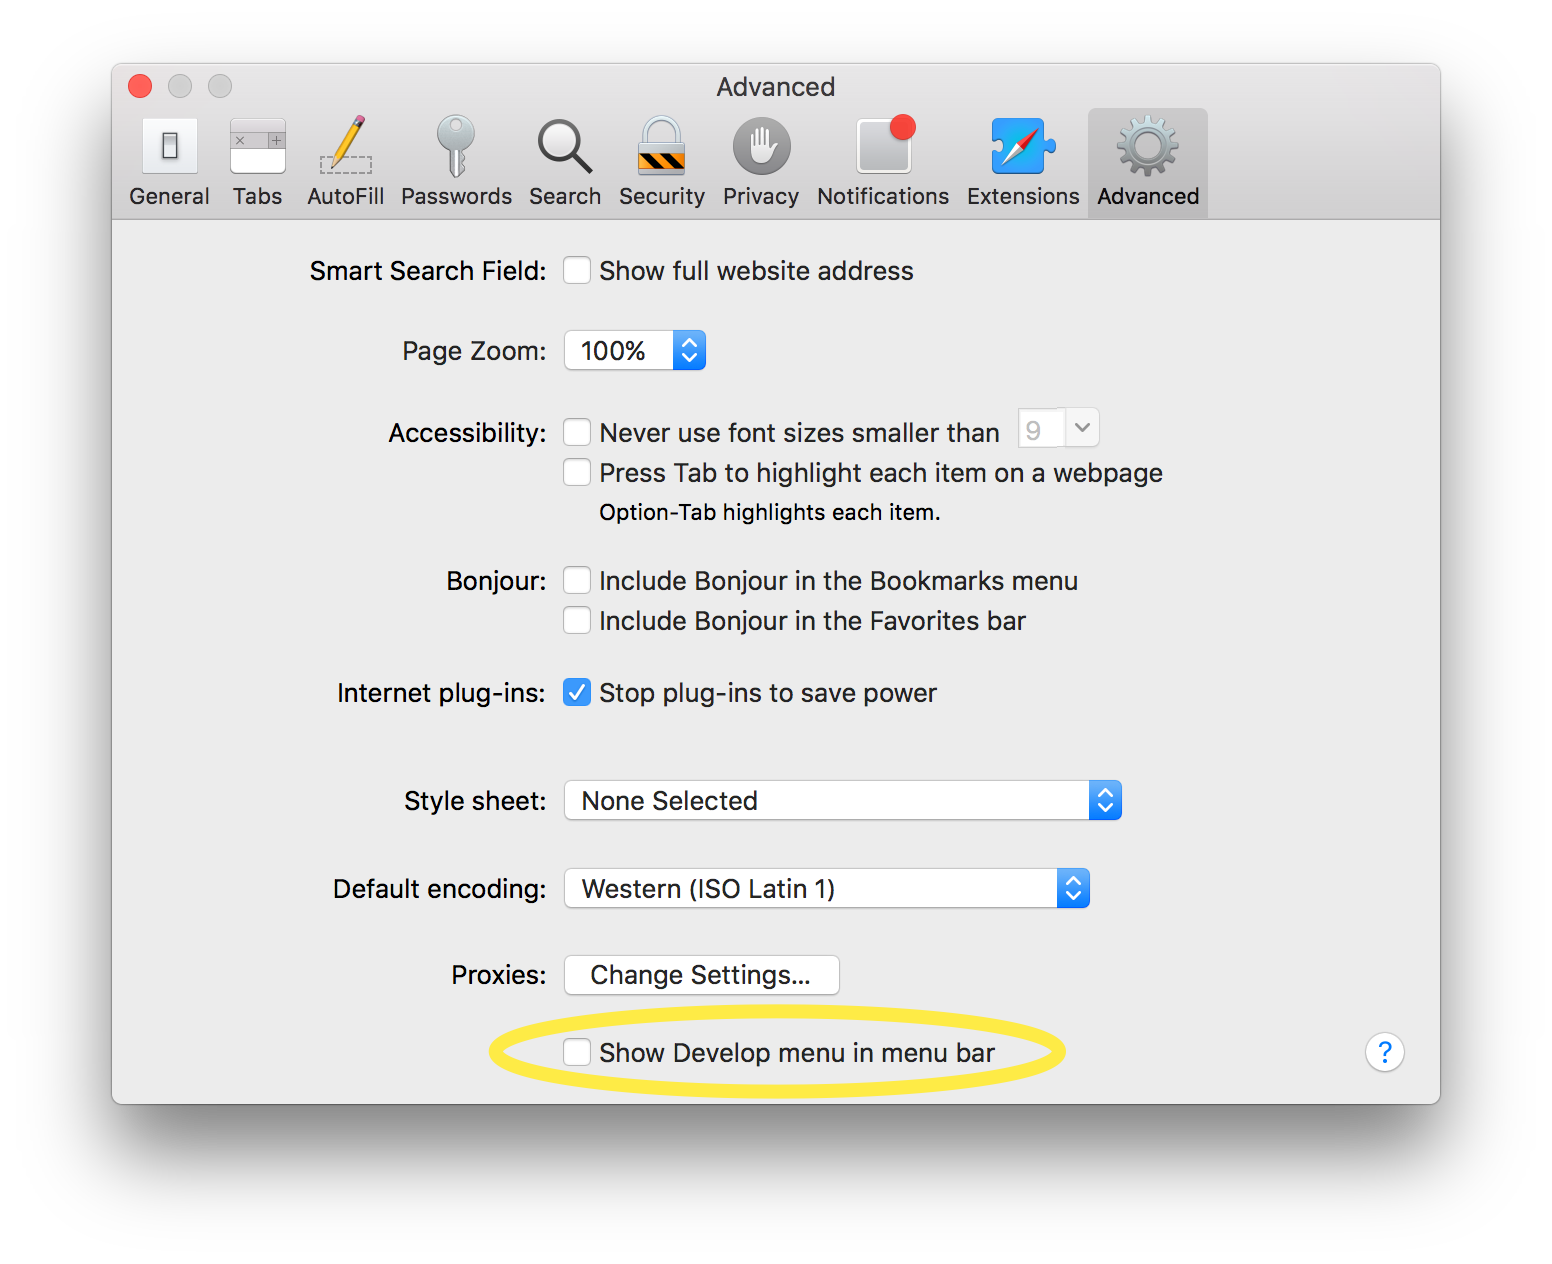
Once in the Preferences dialog, navigate to the Advanced tab, then check the "Show Develop menu in the menu bar" box.
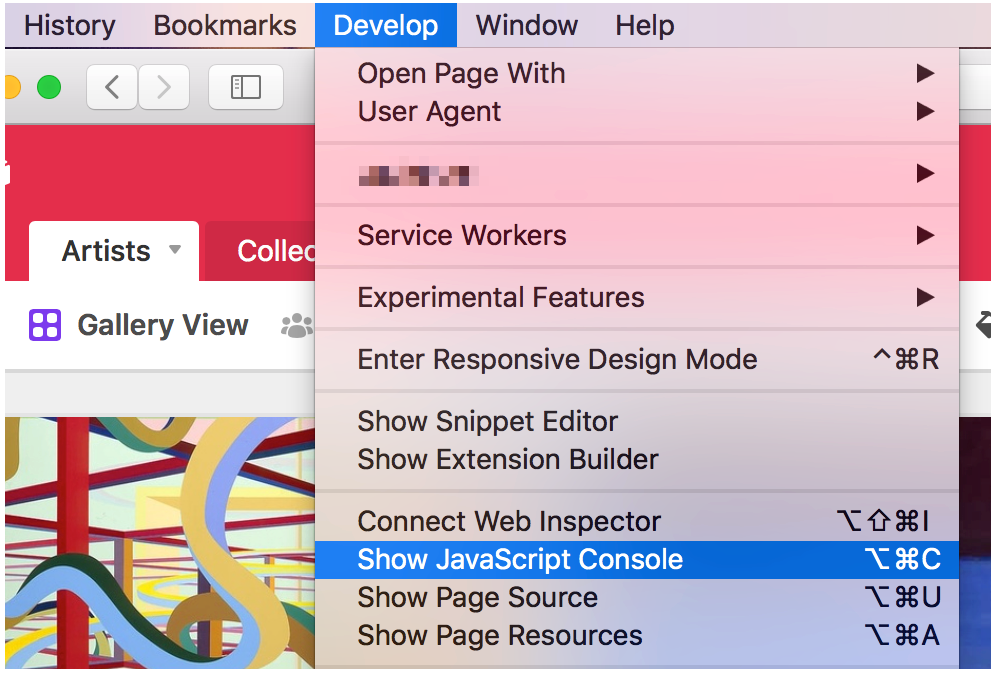
Once the Develop menu has been enabled, you can go to the Develop menu in the menu bar and then select the "Show JavaScript Console" option.
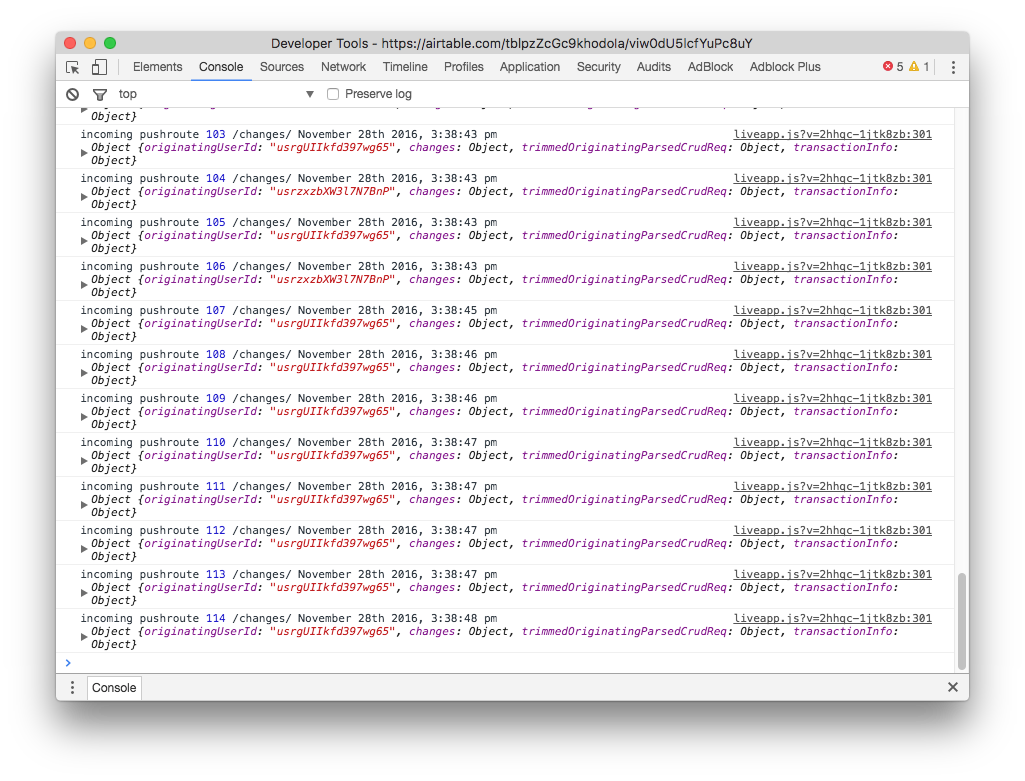
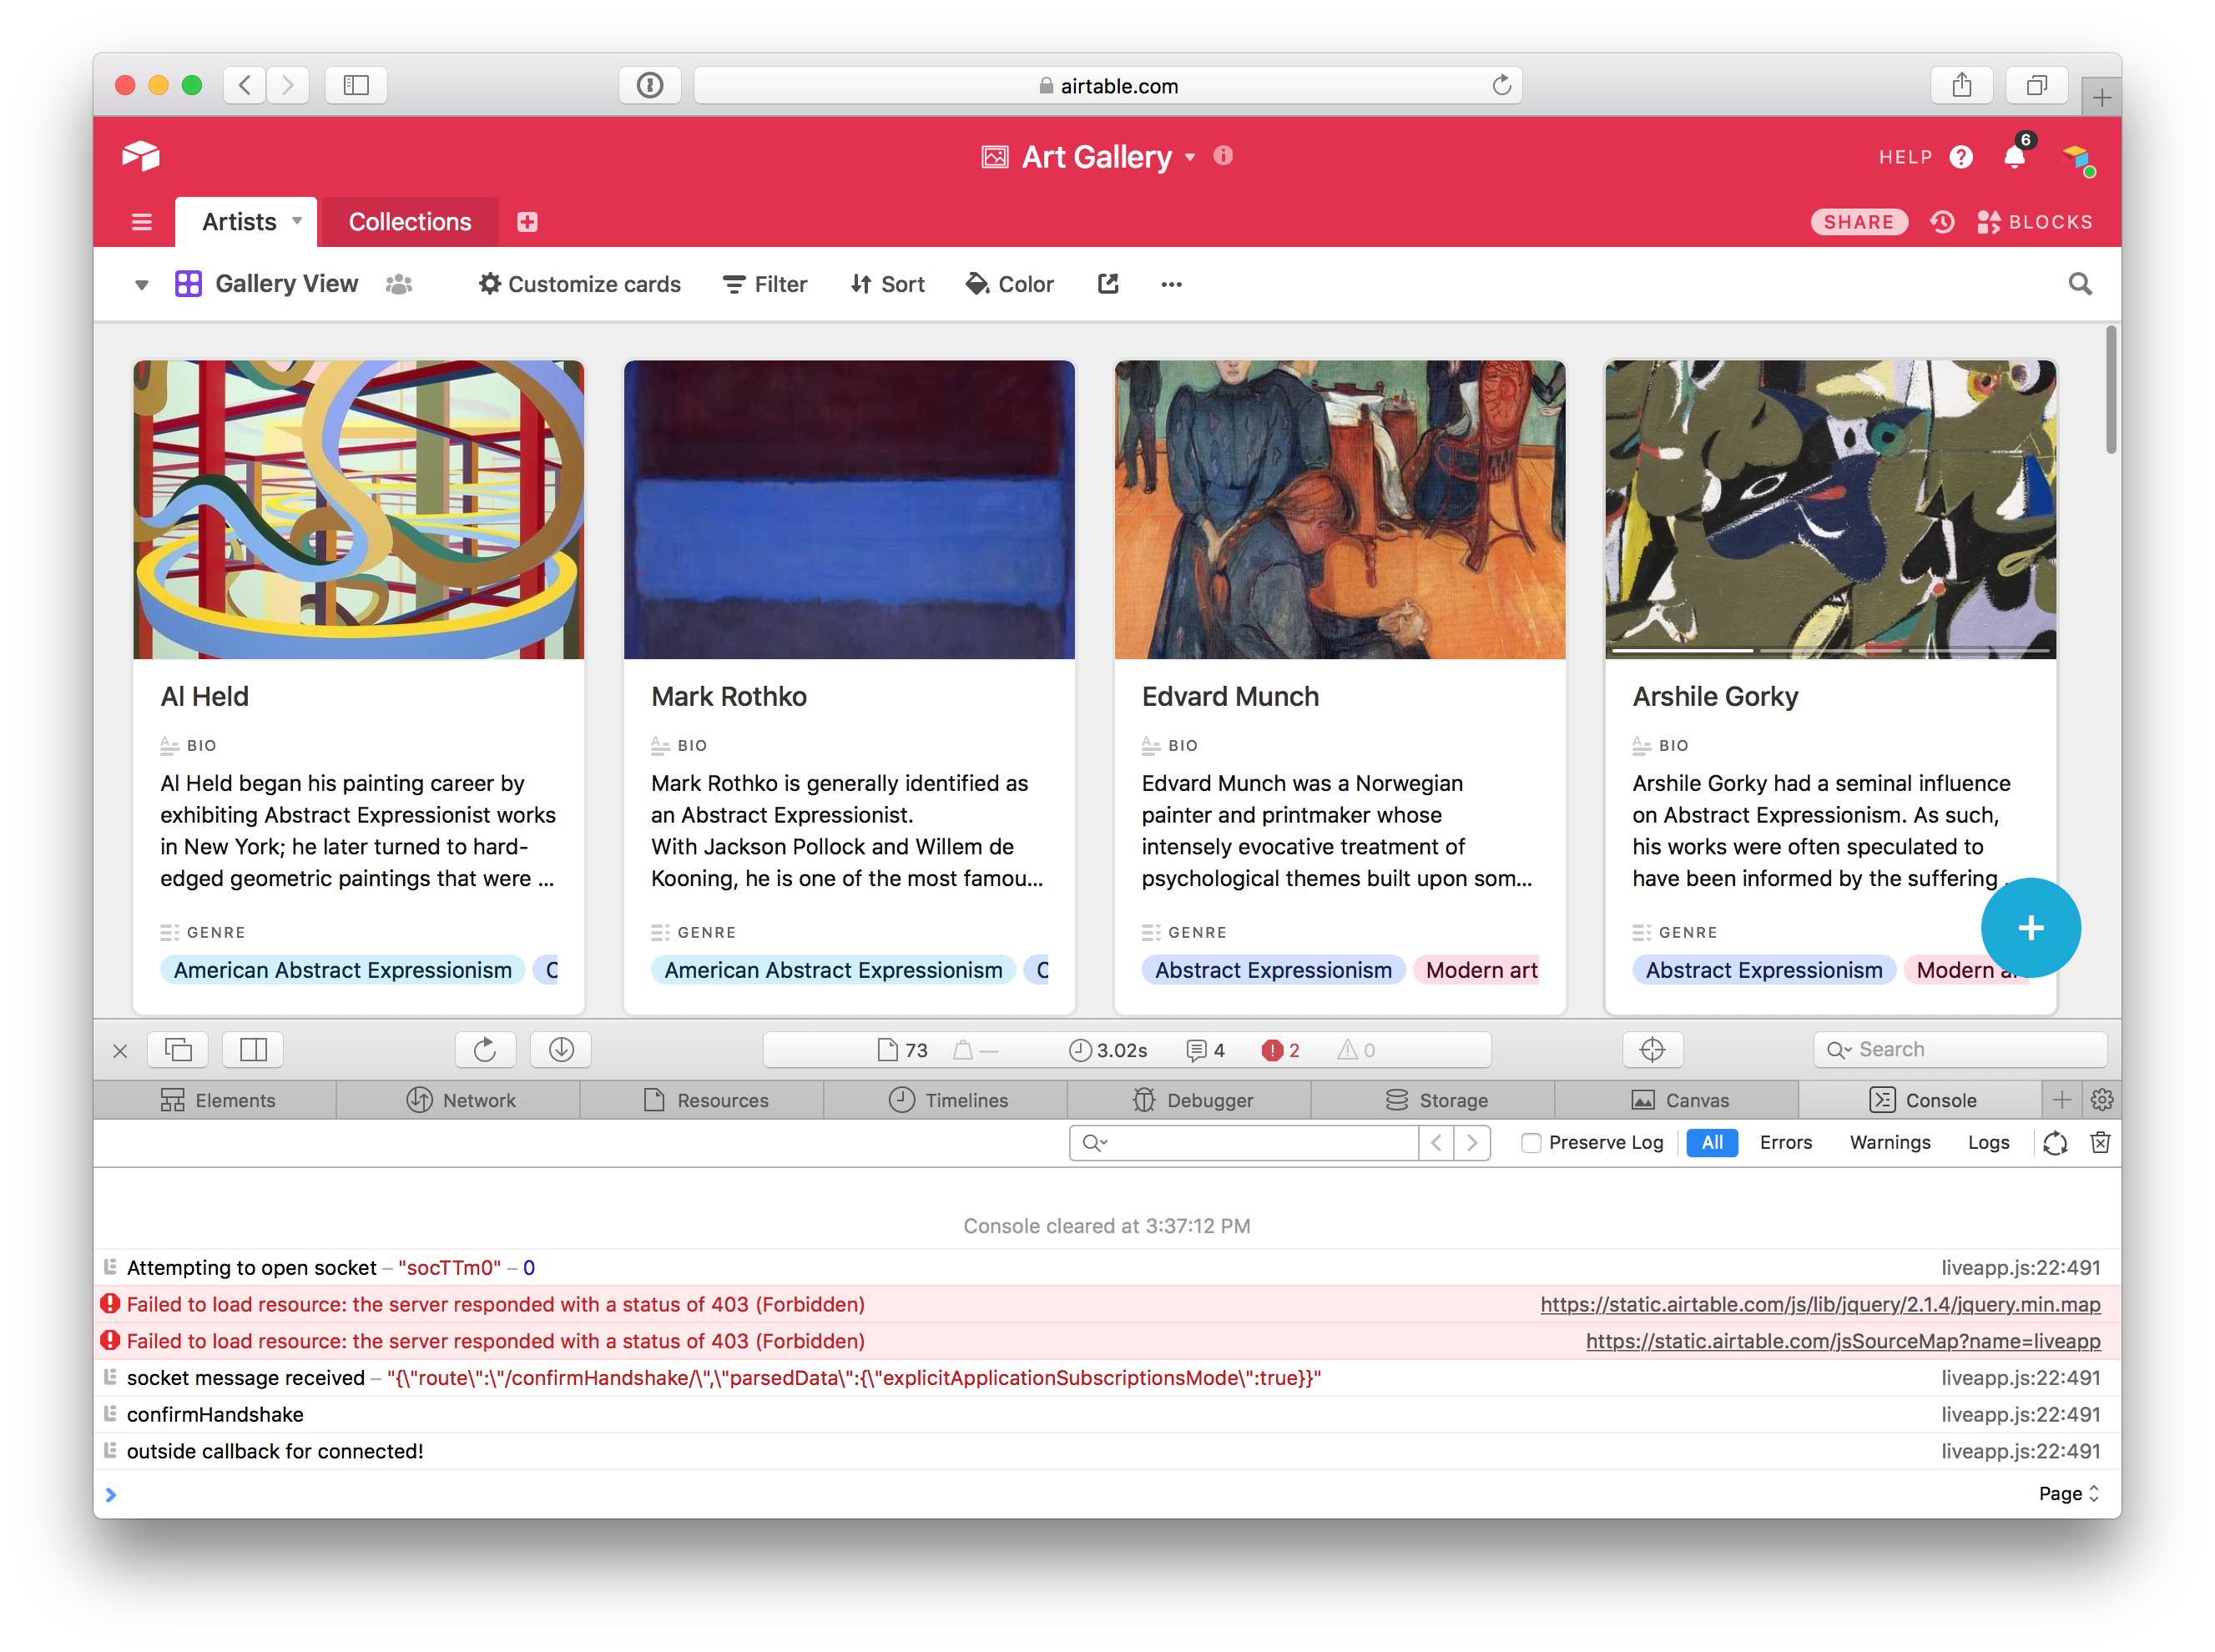
The JavaScript Console will show up on the bottom half of the active browser window.
Alternatively, you can use the keyboard shortcut Option Ctrl C, though note that you will need to enable the Develop menu in your Safari Preferences for this shortcut to work.
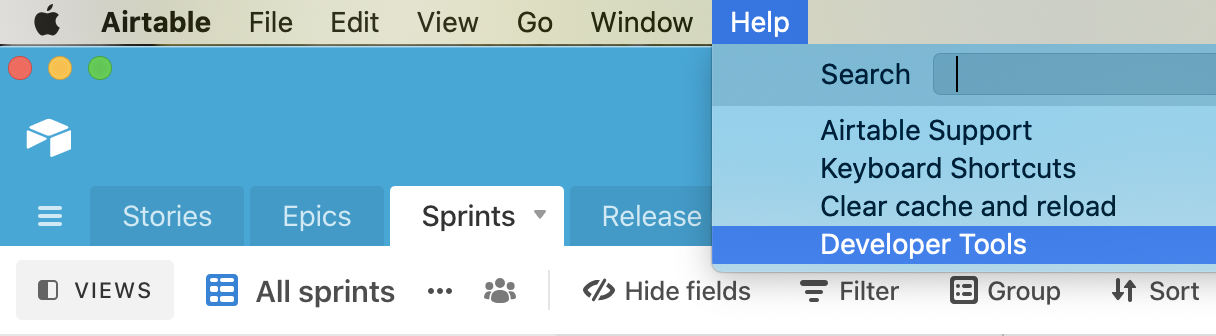
Mac desktop app
To open the console on the Mac desktop app, click "Help" in the Mac menu bar, then select "Developer Tools". This will open the developer console in a new window.