This article details how to use Airtable insights to understand base and interface activity, identify ways to optimize bases and interfaces, and help with base maintenance.
Business and Enterprise Scale plans | |
Permissions | Owners and Creators |
Platform(s) | Web/Browser, Mac app, and Windows app |
Airtable insights glossary & metric definitions
Insights glossary & metric definitions
Term | Definition |
View | A table view within a base |
Page | An interface page |
User | Both authenticated and unauthenticated users (unauthenticated users will be noted as anonymous users) |
Metric | Definition |
Daily active user | A unique user who has opened Airtable and/or made record edits in the last 24 hours |
Weekly active user | A unique user who has opened Airtable and/or made record edits in the last 7 days |
Overall activity | Count of unique users who have taken at least one action (view or page open/record edits) in any part of Airtable |
Base activity | Count of unique users who have taken at least one action (view open/record edits) in the base |
Interface activity | Count of unique users who have taken at least one action (page open/record edits) in interfaces |
Days active | Count of days in a row the same user has taken at least one action (view or page open/record edits) |
Opens | Navigating to, or refreshing, a view or interface page |
Record edits | Count of all edits a user made to records in either views or interface pages |
Record activity by base or interface | The total number of times there have been record edits in either the base or interfaces |
Top users | The total count of activity across all metrics on the top users table, ranking users from highest total to lowest |
Top places (bar chart) | The top 10 interface pages and views based on opens, ranked from highest to lowest |
Top places (details table) | The top interface pages and views based on the total count of opens plus activity, ranked from highest to lowest |
Accessing insights in Airtable
To access insights:
Open your Airtable homepage.
Create or open your preferred base.
Click Tools in the top right, next to “Extensions”.
Select Insights from the “Tools” menu.
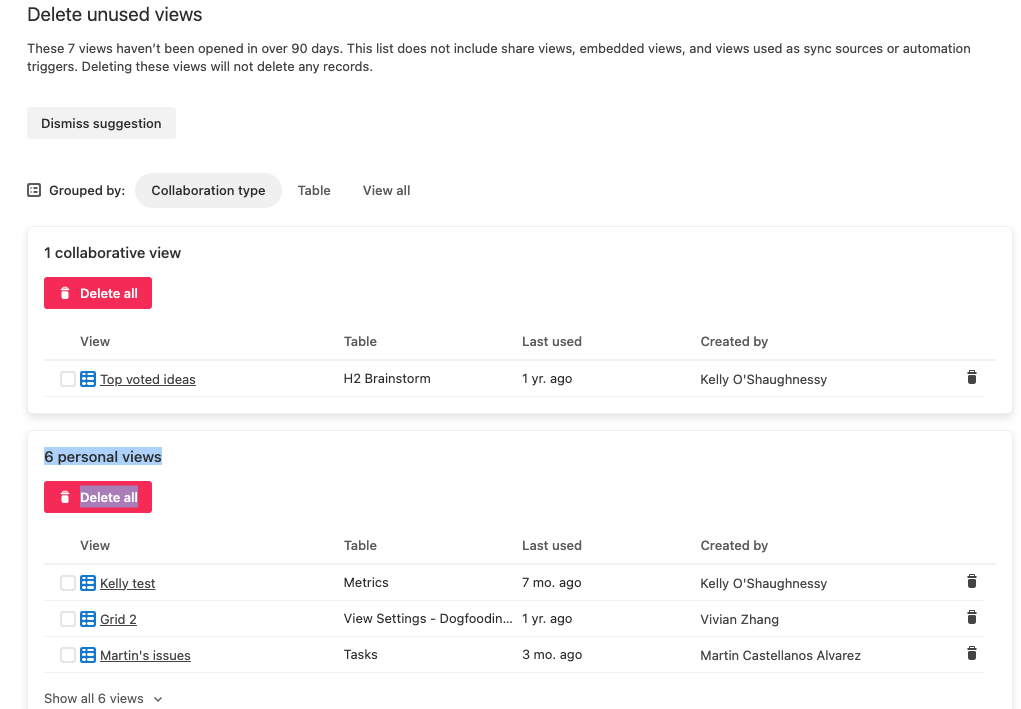
Airtable base suggestions
To access base suggestions:
Open your Airtable homepage.
Create or open your preferred base.
Click Tools in the top right, next to “Extensions”.
Select Insights from the “Tools” menu.
If you have any base suggestions, they will appear at the top of the “Insights” window.
.png)
Activity & daily active users
Activity and daily active users overview
The “Activity” section provides helpful insights into how your base or interface is being used by collaborators. With these insights, you have access to base or interface visits over time, collaborator activity, and record activity in views vs interface pages.
Directly above the “Daily active users” section provides high-level information detailing your total number of app, base, and interface visits.
The “Daily active users” section offers:
The overall number of daily active users + a breakdown of daily active users (interface vs base).
Record activity by surface area.
The top base and interface users.
The top base or interface places (most visited views/interface pages).
The ability to filter daily active user data by users, tables, and interfaces.
The ability to filter by time frame (last week, last month, and last quarter).
Insights CSVs
To download insights CSVs:
Open your Airtable homepage.
Create or open your preferred base.
Click Tools in the top right, next to “Extensions”.
Select Insights from the “Tools” menu.
Insights are available for: Daily active users, Record activity surface, Top users, and Top places.
Click the ˅ icon next to your preferred insight.
Click Download CSV.
Top places bar chart & top places detail view
Top places overview
The top places bar chart gives insight into your top 10 interface pages and views based on opens, ranked from highest to lowest.
Included below the top places bar chart is the top places detail table. The detail table allows you to select individual places (interface pages and views), opening a detailed view into that place's usage and more.
.png)