All paid plans | |
| |
Platform(s) | Web/Browser, Mac app, and Windows app |
Related reading | |
Extension - Extensions are modular components that add visuals or functionality to a base, and were shown in the base's dashboard. Users can create custom extensions, or they can use extensions created by Airtable or other open-source extensions. |
Getting started with the Vega-lite chart extension
The Vega-Lite chart extension provides advanced customizability for charts. Fulfill all your reporting needs with control over the display of colors, spacing, and annotation on the parts of the chart. Layer one chart ( mark) type over the other for richer information in the same space or use faceting to generate the same chart for different subsets of the same data.


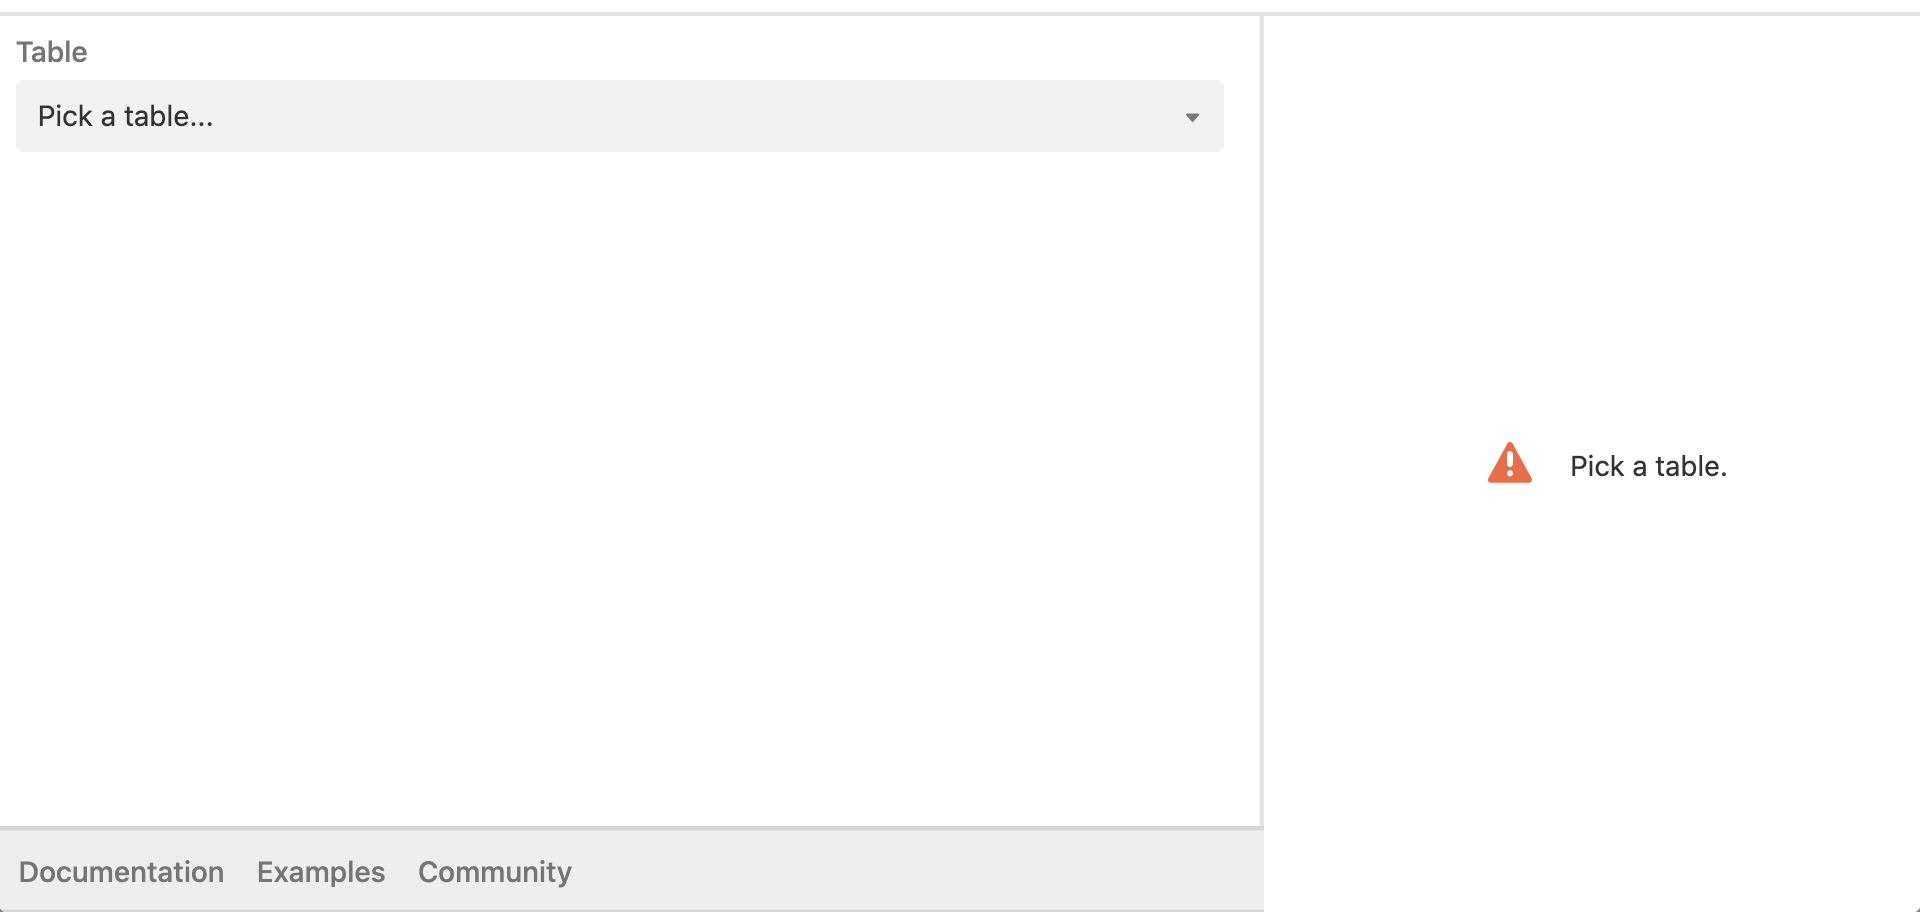
When you first add the extension to your dashboard, you are prompted to pick a table for the chart.

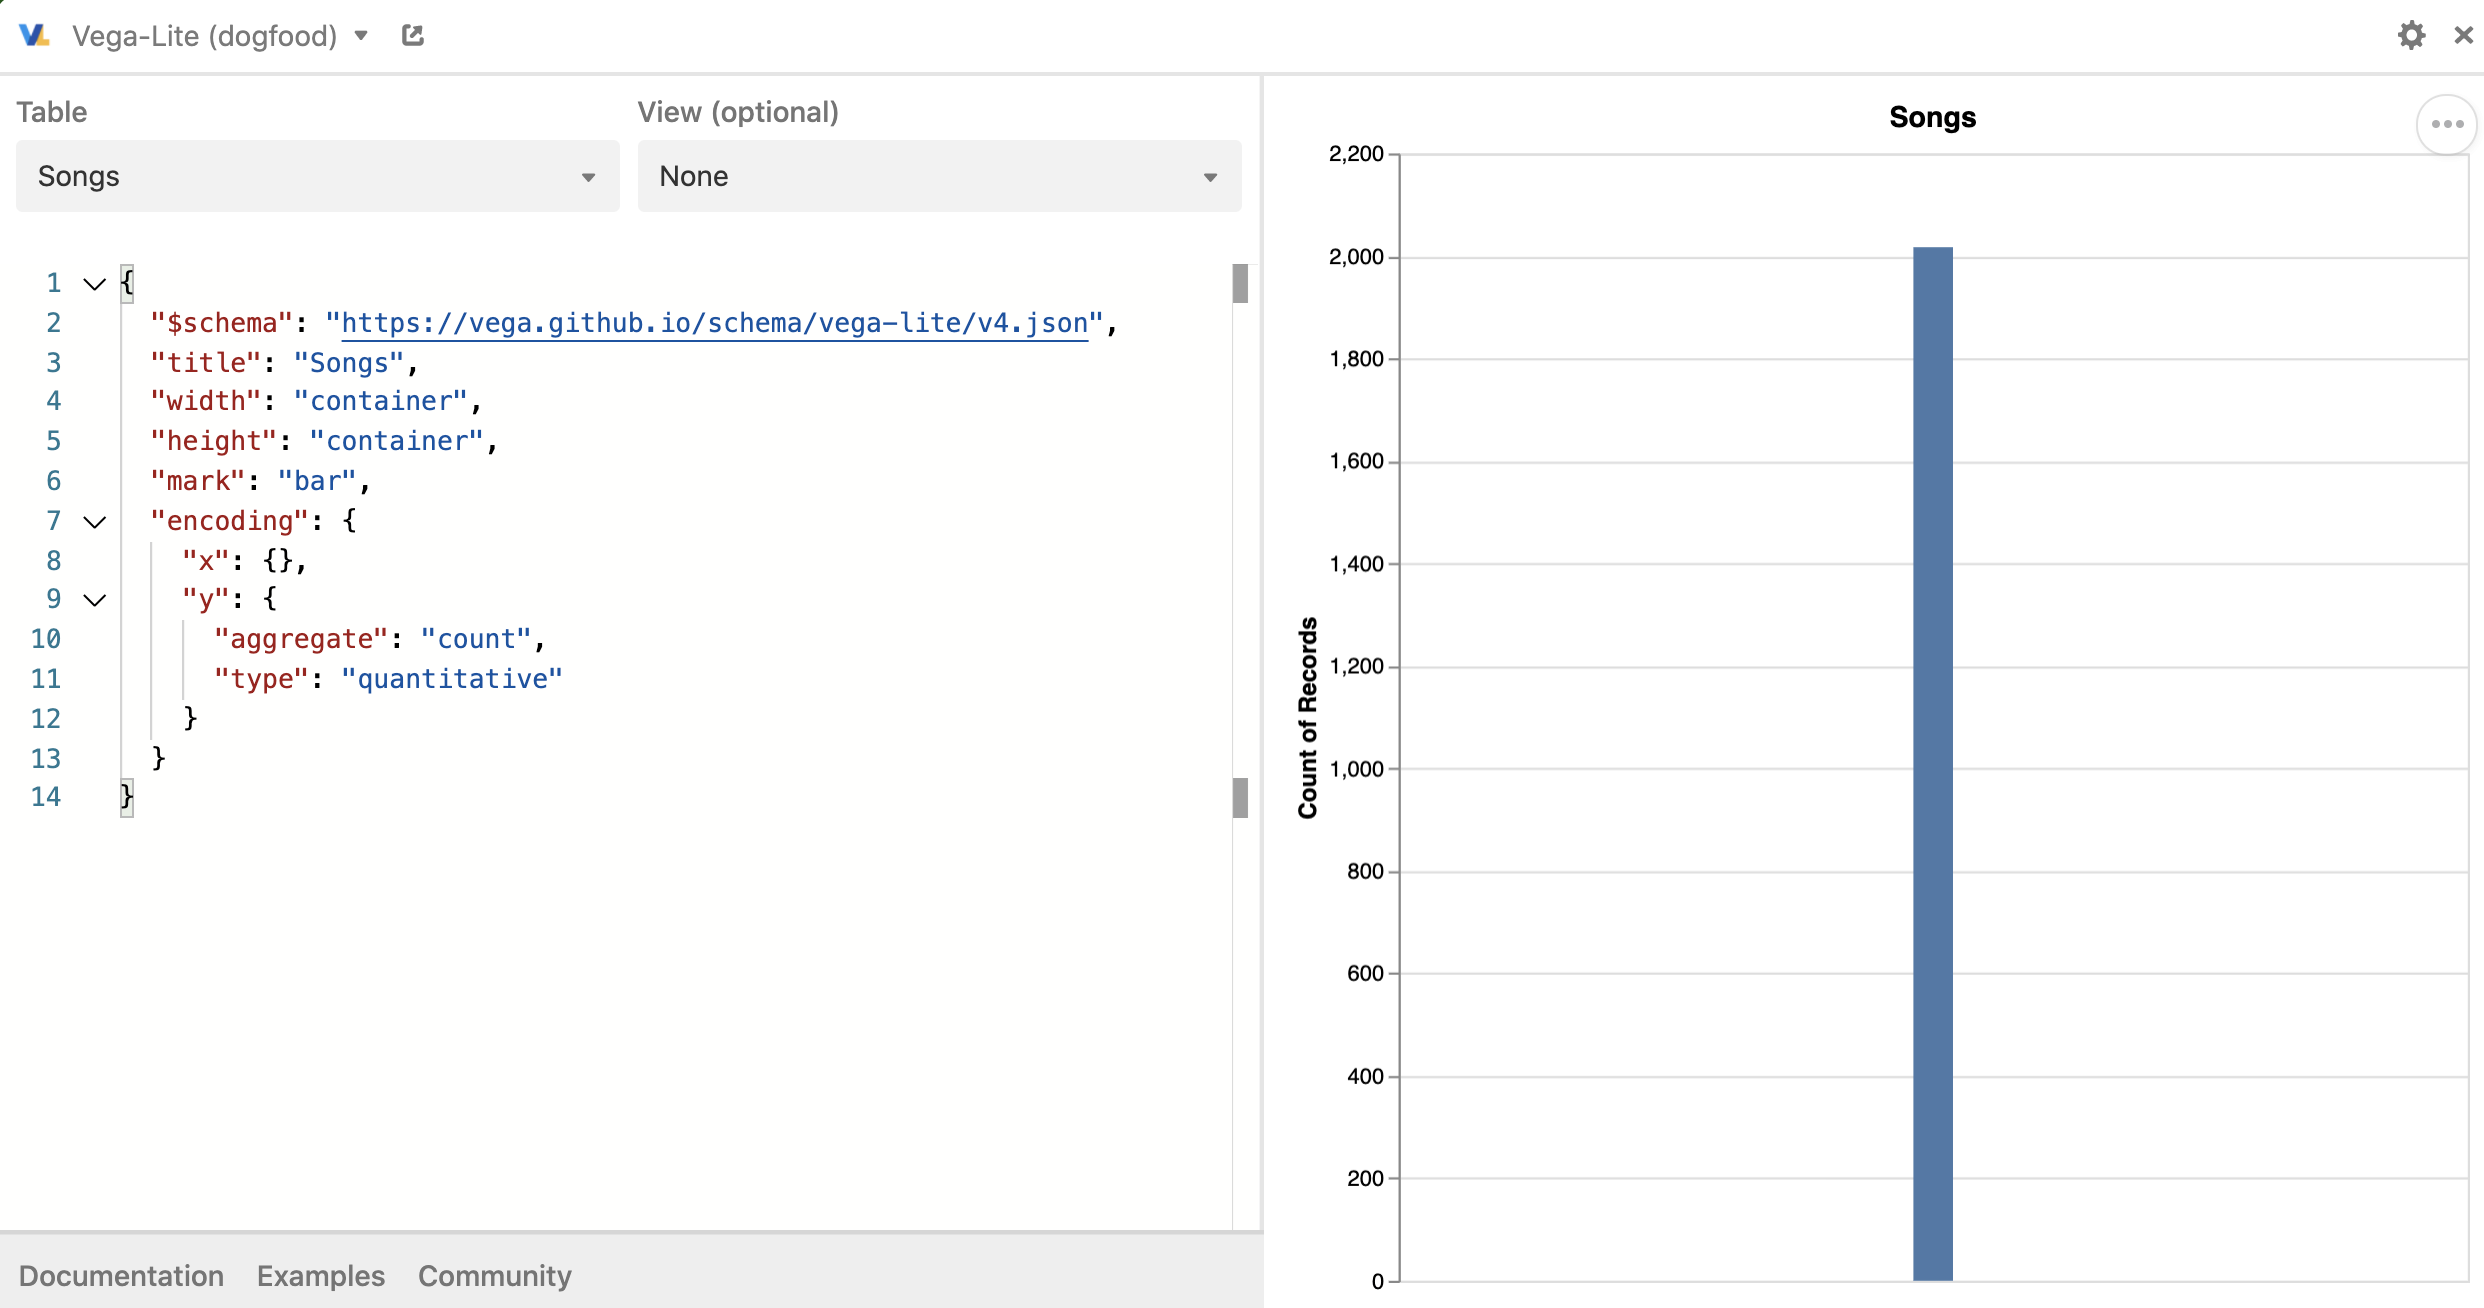
You can optionally choose a view for the chart or leave the view set to none to include all records.
The Vega-Lite chart extension is configured using JSON which appears in the left pane. When you select a table, the JSON for a bar chart is created automatically.
Note that the JSON created by default does NOT have a data property. This is because selecting the table adds that data property behind the scenes for you.

For this example, we will set the x-axis to show the relative length of the songs (long medium, short) from a field that already exists in the table.
In the "x" property, the field references the "Song length" field in the table, and the type is set to ordinal. For more information on the types for fields, see Vega-Lite's type documentation.
You can type directly in the left pane to edit the JSON.
"x": {"field":"Song length", "type":"ordinal"}

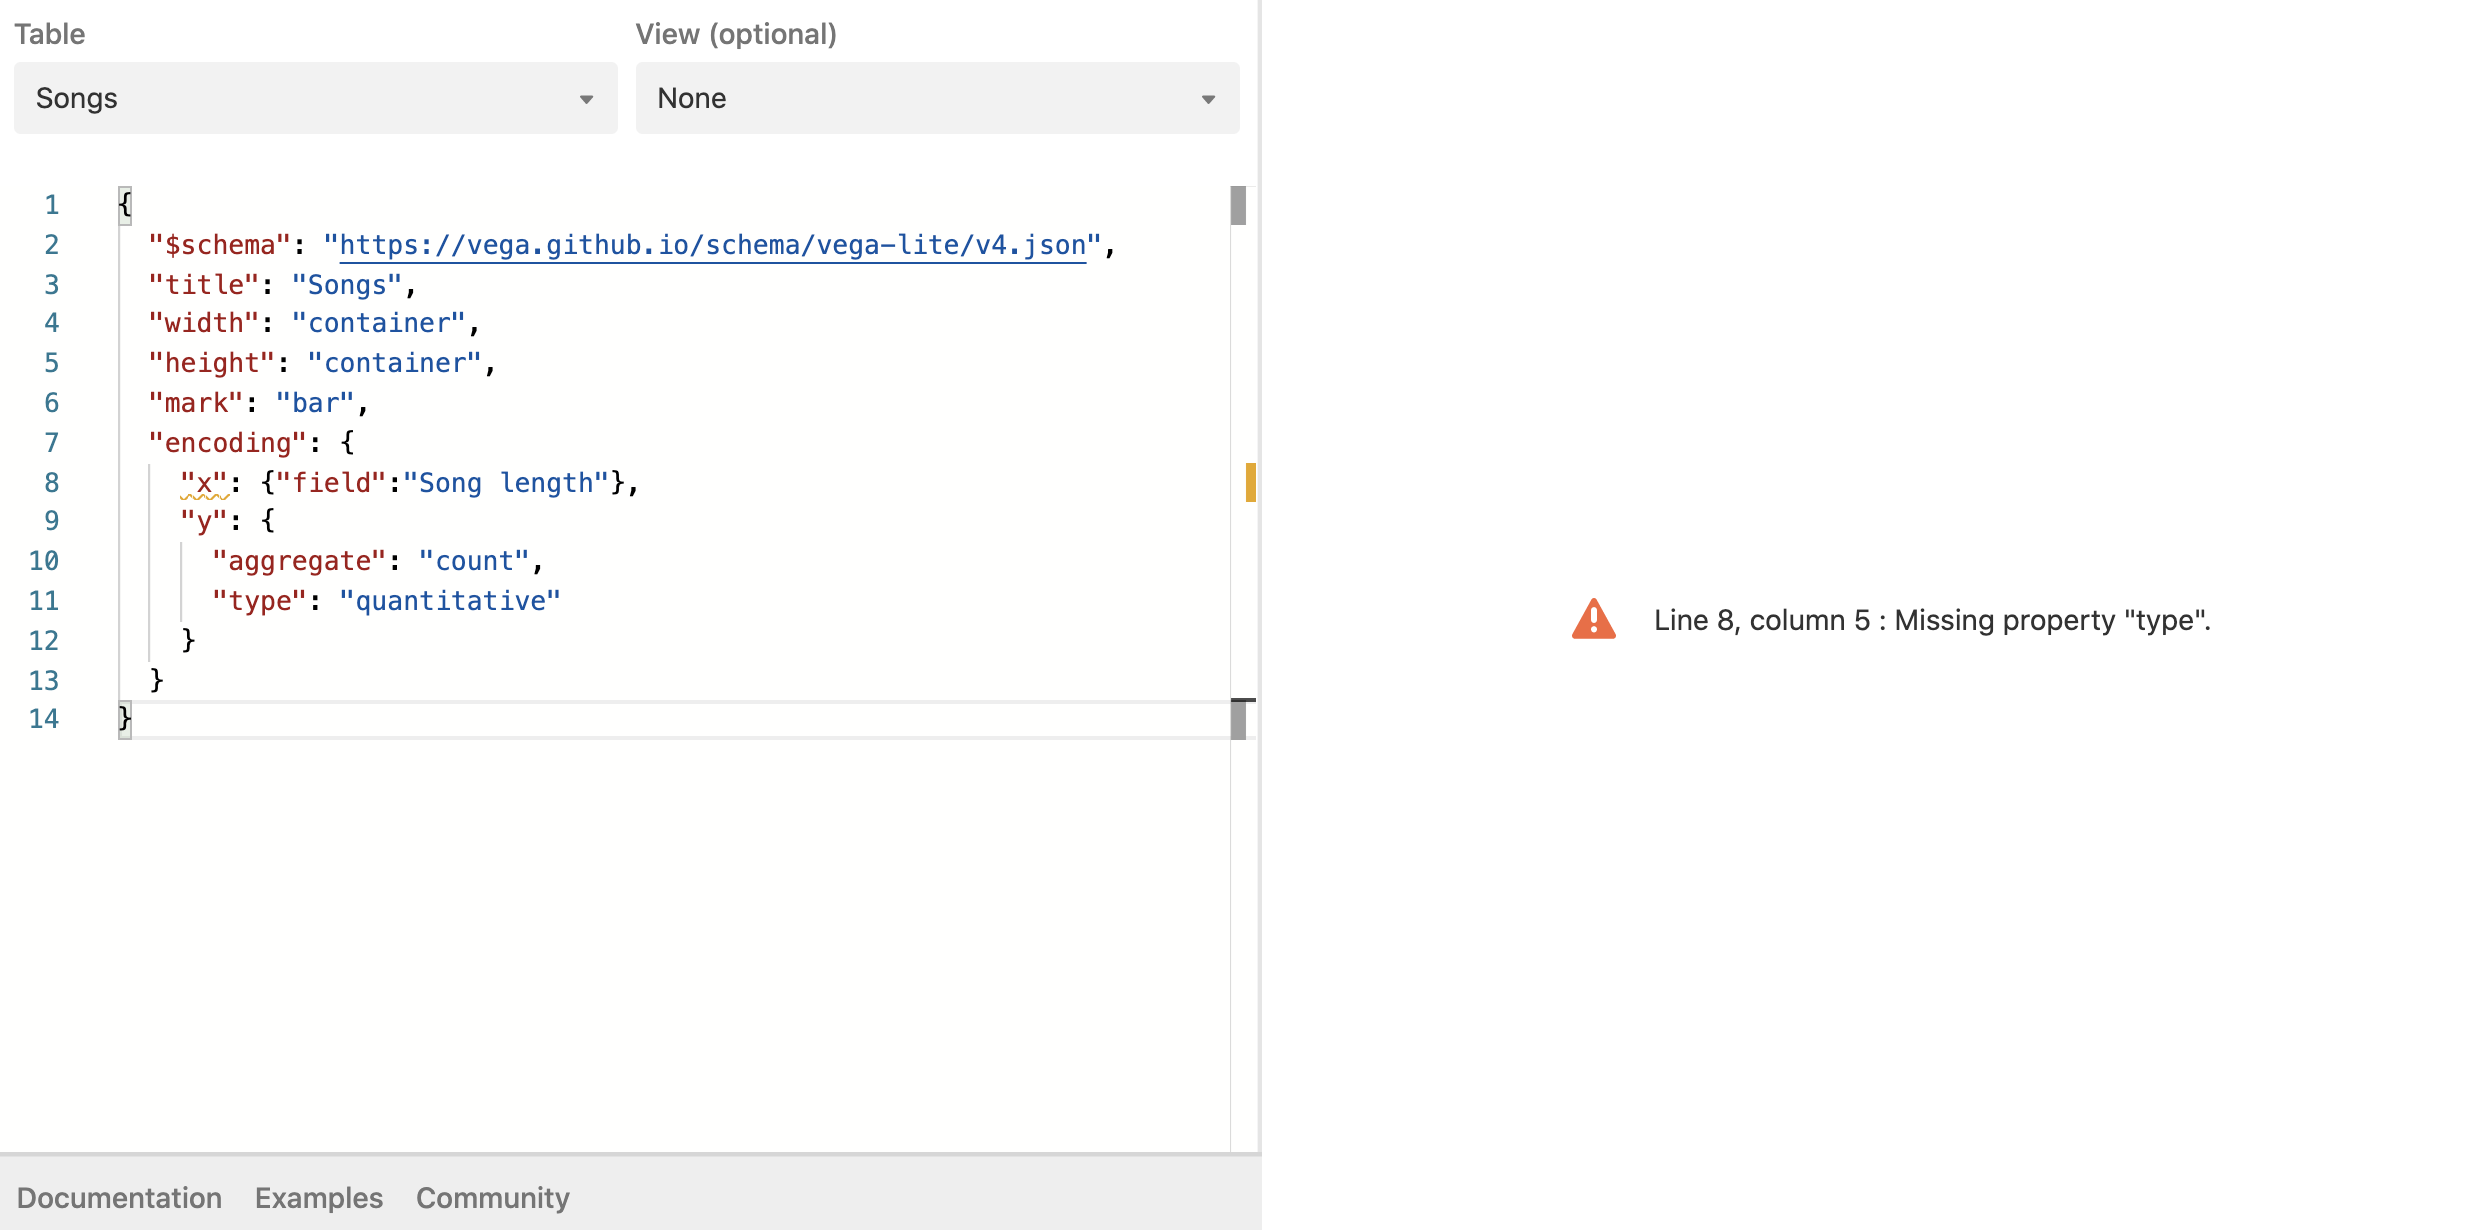
As you type, the right pane will either show a chart or will provide simple error descriptions if the configuration is not well-formed. For example, when you add a field without specifying a type, you will see an error with the line, column (character position), and error message.

Vega-lite documentation and examples
The Vega-Lite website has extensive tutorials, documentation, and examples to support simple to advanced charts. The following is a lightweight reference to parts of that documentation that can get you started the most quickly.
A chart can have multiple views which in Vega-lite means a specification for a single mark type (bar chart, scatter plot, line chart, etc.). The multiple views are managed with view composition.
Each mark type can have additional properties. For example, the bar chart has an orient property to change the direction of the bars from vertical to horizontal.
You could change the height and width of the chart but for the chart to fill the space it is best to leave the height and width set to "container".
You can control the colors in the chart by using the color property.
FAQs
Are there templates available for the chart I need?
Check out the examples at Vega-Lite.
Examples at Vega-Lite include a data property in the JSON. What do I do with that?
You can delete the data property completely from the JSON. When you choose the table, the value of the data property is set automatically.
The initial JSON has height and width is set to container. What does that mean?
By setting the height and width to “container”, your chart will be responsive in that it will stretch to the width and height of your extension. It is recommended you keep the height and width with the default value so that you can use the extension's resizing feature to change the dimensions.
How do I reference fields while editing the JSON? Do I need to enclose in curly brackets like I do with formulas?
Unlike formulas, no curly braces are needed in the Vega-Lite JSON configuration. You will either include the field name only or the field name with "datum" in front of it depending on the property.
For field properties:
"field":"Song length"For transforms on the data such as filtering or calculations, you can use "datum". However, a simpler approach is to choose an Airtable view that already has the filtering and calculations (through formula fields) that you need.
{"filter": "datum.key == 4"}{"filter": "datum['Song length'] === 'long'"}