Plan availability | All plan types |
Permissions |
|
Platform(s) | Web/Browser, Mac app, Windows app, and some basic functionality on iOS and Android mobile apps |
Summary bar overview
Learn about the summary bar, an Airtable base metadata feature that provides different types of summarizations of all the cell values in a given field.
Note
The summary bar is a great tool that can be used to quickly understand and calculate values for a set of records. However, the summary bar can't be referenced by Airtable records. Summary values are a type of metadata not currently accessible by record-level formulas.
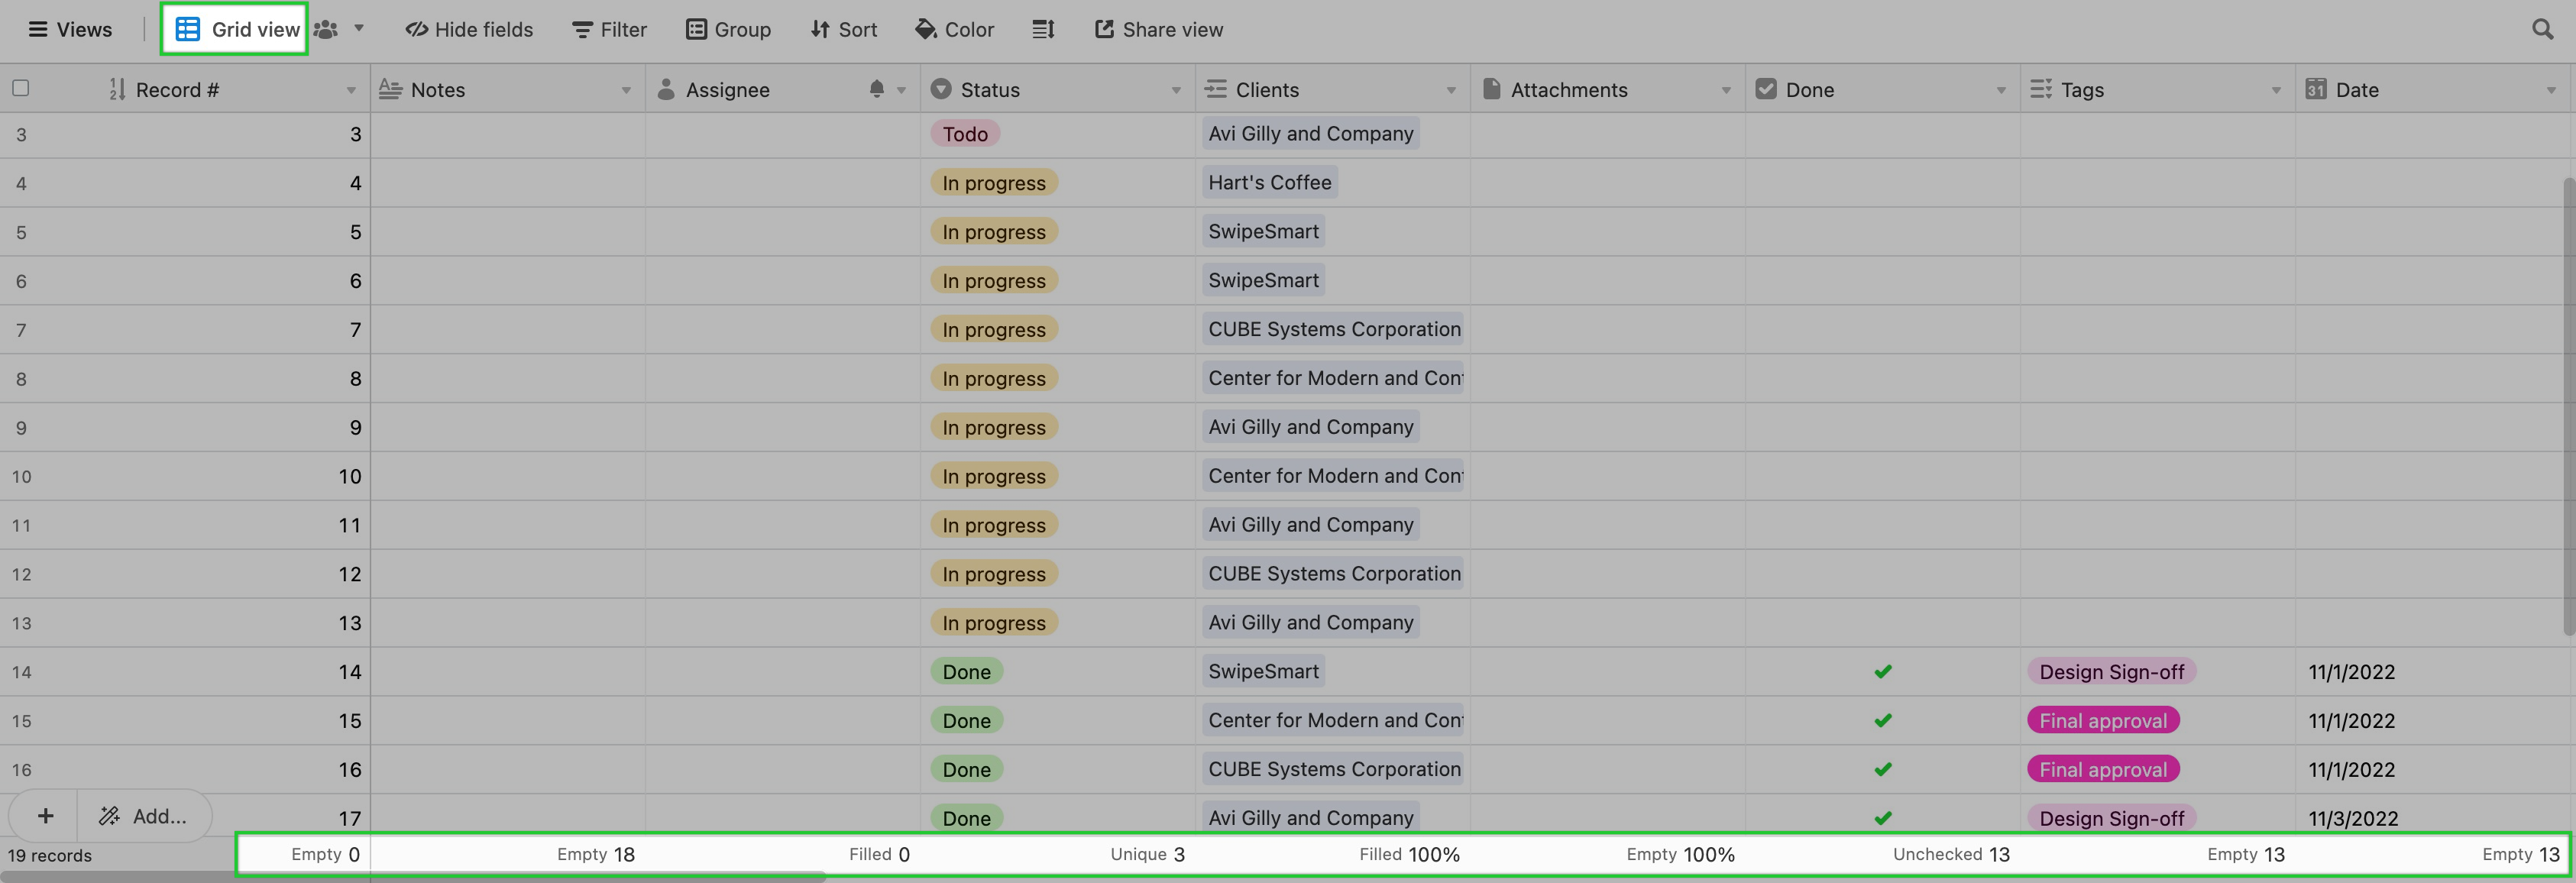
Finding the summary bar
The summary bar is located at the bottom of some view types within a table. Certain field types will offer different summary options. Those differences are covered in more depth below.
Choosing summary bar functions
By default, the summary function for each numeric field is Sum, and the summary function for non-numeric fields is blank. To select a different summarization function for a specific field, click on the summary bar below that field. This will bring up a menu of different summary functions. The types of summary functions available will depend on the type of field.
Non-numeric - Certain summary functions are available in all non-calculated fields (i.e. not formula, rollup, or lookup):
Empty
Filled
Percent Empty
Percent Filled
Checkbox fields - For checkbox fields, the summary functions will display slightly differently:
Unchecked
Checked
Percent Unchecked
Percent Checked
Numeric fields - Certain functions will only appear in numeric fields (i.e. number, currency, percent, and autonumber).
Sum
Average
Histogram
Min
Max
Range
Median
Standard Deviation
Date fields - Certain functions will only appear in date fields. These are, as follows:
Earliest Date
Latest Date
Date Range (days)
Date Range (months)
Attachement fields - A special summary function for an attachment field allows you to see the total (summed) size of the file attachments in the attachment field, in bytes.
Many field types will also include functions that allow you to calculate the absolute number of unique values present in a field, and the percentage of cell values that are unique in a field, respectively:
Unique
Percent Unique
Summarizing a subset of records in the summary bar
If you select a range of rows or cells, the summarization will only include cells that are in that selection range.
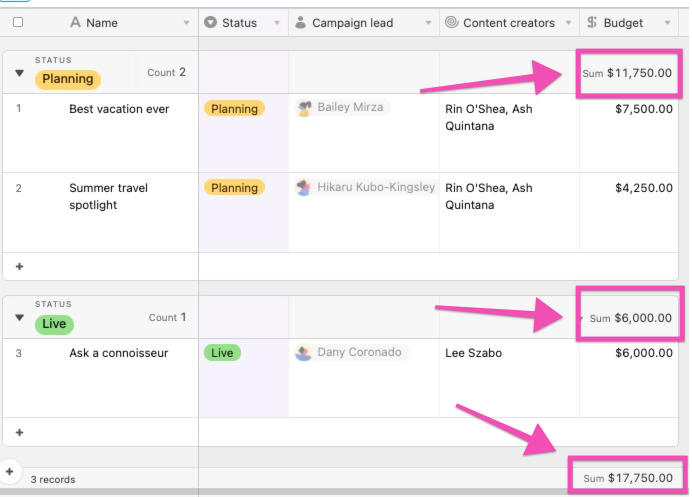
Grouped summaries in the summary bar
If the records in your view are grouped then your summary bar will automatically show a separate summary for each group, as well as the total summary for the field as a whole:
FAQs
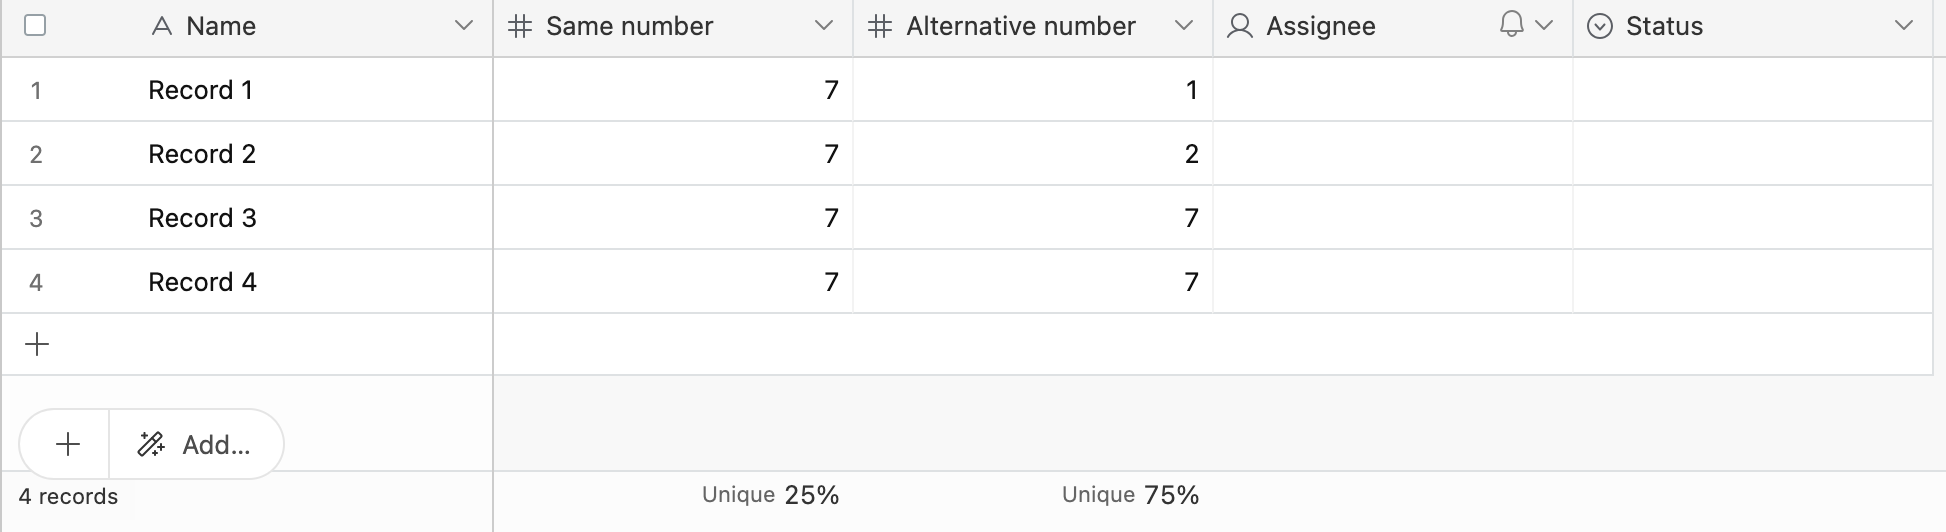
How is the Percent unique function calculated?
The Percent unique function calculates the ratio of cells containing unique values in a field. It counts the number of distinct values and divides that number by the total count of cells in the field. This provides a useful way to understand the variety and distribution of data within a field in your Airtable base, even when values are repeated.
Example:
Let's say you have four records. Each record contains a number field and each cell within that field contains the number 7.
The Percent unique summary function identifies that there is 1 unique value here, which is 7. It calculates the Percent unique as 1 (unique value) divided by 4 (total cells/records), giving 0.25, or 25%.
Alternatively, if you have four cells containing multiple values, like this: [1, 2, 7, 7], the function identifies 3 distinct or unique values, which are 1, 2, and 7. It calculates the Percent unique as 3 (unique values) divided by 4 (total cells/records), giving 0.75, or 75%.