Plan availability | All plan types |
Permissions |
|
Platform(s) | Web/Browser, Mac app, Windows app, and some basic functionality on iOS and Android mobile apps |
Why should I use views instead of tables in Airtable?
Views offer a specific way to look at and organize the underlying data in a table. The default type of view is a grid, but other types include form, calendar, gallery, and Kanban. A given table can have multiple views and multiple types of views. Views can also be configured based on permissions, with collaborative, personal, and locked views.
By using views instead of tables, admins and creators can keep specific kinds of data organized—in the same base—but divided among a series of views tailored to a particular type of information that is still accessible outside of its particular view.
When should views be used instead of tables?
Views can be more beneficial than tables if you frequently:
Copy and paste tables or records from one table to another.
Combine tables that track similar information—to find a data overview.
Create individual tables for collaborators and their related information.
Create tables for things like individual months, social media platforms, steps in a process, collaborators' tasks, and events.
Example: Using tables instead of views
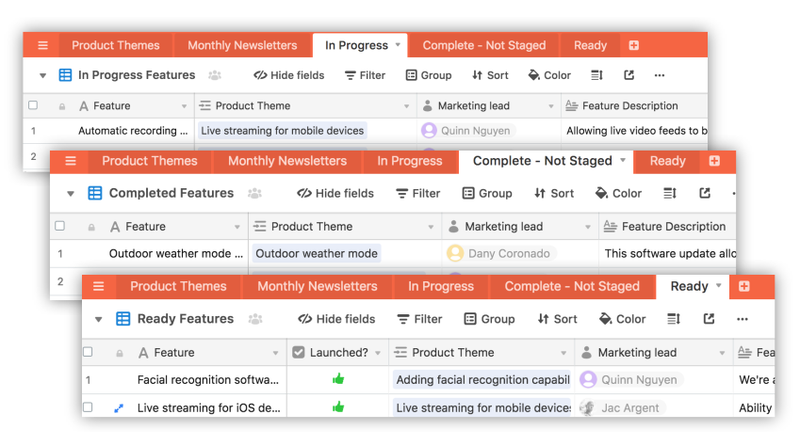
In the example below, the base owner has a table for each stage in their process:
An easy resolution is to store all the information in a single table using multiple views:
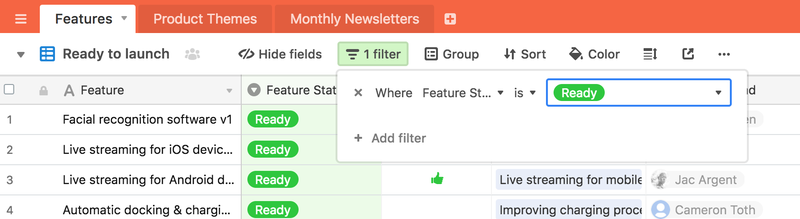
Combining multiple tables into one with multiple views
Add a field to hold the name of the table for every table that will be merged
Note
Be sure to only create single-line text fields in this step of the combining process.
Open your Airtable home screen.
Open your base with multiple tables that you want to combine.
Create a field in each table to store what is unique about each individual table.
For example, if your individual tables were created to represent each month of the year, make a “Month” field.
Make the new fields in every table a Single Line Text field for now. We can change this to a single select field or a linked record field type later.
Populate the new field in all old tables with the name of the table
Each table will have the same value in the new field. For a set of tables that differed only by month then the January table would have “January” as the value of all of the records in that table.
In the Product Launch example, we can use the values of “In Progress”, “Complete”, and “Ready” in each of the tables.
Duplicate one of the tables to be merged to be the new table
If all of the tables to be merged have the same fields in the same order with the same field types, then you can make your new combined table from a copy of any of the tables. However, if some tables contain additional information not found in the others then you would choose the table with the most fields and add the additional fields found in other tables. Make sure these additional fields are the same field types across all tables to be merged but you can leave them with empty values.
In the Product Launch example, the In Progress and Complete tables do not have a “Launched?” field nor a “Ready for Launch?” field. The Ready to Launch table has a more complete set of fields so we use that as the table to copy. We name this new table Features.
Create new views in the new table to recreate the old tables
These new views are used to copy the old records to the new table. If you have three original tables, you will want to create at least one view for each of the original tables with the same fields in the same order. If you don't have a view from the original table that has all the fields unhidden, make one.
In the Product Launch example, we create three views named “In Progress Grid”, a “Completed - Not Staged Grid” and “Ready to Launch Grid” in the Feature table.
Copy the records from the old tables to the new table
You can select all the records from the old table using the checkbox in the upper left and paste it into the matching view you just made in the new table. You can use keyboard shortcuts to copy (Ctrl + C) and paste (Ctrl + V).
In the Product Launch base, the “In Progress Grid” in the Complete - Not Staged table can be copied into the “Completed” view in the new Feature table. The In Progress table can be copied the same way.
(Optional): Summarize by using a linked record field and a count field
Want to count items across all the new views you just made? Change the field type of the field you created in the first step to a linked record. When prompted, create a new table instead of linking to an existing table. Converting to a linked record field type will make a record for every distinct value from that field in the new table. You can then add rollup or count fields to create a summary based on the original tables.
In the Product Launch table, the Feature Status was the new field that was added to all the original tables. When this field is changed to a linked record field, three new records are created (“In Progress”, “Ready”, “Complete”) with the proper link to each record. By adding a count field, this new Feature Status table can show detailed summaries for each status.
Delete all the old tables
When you are satisfied that all records have been moved to the new table and views have been made in the new table, you can delete the original tables.
In the Product Launch table, delete the In Progress, Ready and Complete tables.
Transferring data from a table in one base to another base
NOTE
One-way syncing allows you to link from a source table to a destination table, which means that in the destination base, you cannot:
Add or delete records in the synced table
Edit information in the synced fields
If you need the ability to edit fields in the destination table—where your information is displayed—we suggest using a two-way sync.
Workflow option 1:
An option to display information from one base in another base is to use the Airtable sync feature.
To create a sync:
Open your Airtable homepage.
Open your preferred base.
Create a syncable view share link.
Select how you want to create the sync in the destination base.
Configure and create your synced table.
Workflow option 2:
Another option you could use to display information from one base in another, is to join your tables that hold similar categories of data together. Before getting started, we recommend giving this article a read. It may make more sense to import each of your separate tables into the same table, if they all contain the same type of data (all events, or people, or tasks, etc.), with each batch of records added from respective tables categorized through a single select field.
This could be done by exporting each table as a CSV and using the import extension to pull them one-by-one into the destination table. Otherwise, if the field configurations match up between source and destination table, copy and paste may come in useful.
There is no push-button way to relocate a table to another base, due to the fact that a table can be relationally very bound up with other tables existing within a base; this is indeed one of the most powerful features of Airtable. You can download the table as a CSV and re-upload it as a new table in the desired base, but you'd want to configure the columns in your new table to match the original columns ahead of time by adding fields and using their customization menus. Setting field type and formatting is enough -- e.g., if you have a single select field, any values that appear in its cells from a data paste will automatically be turned into field options. You could also use copy and paste to pull data into the new table, after similarly setting up your fields to accept the new data as the right type.
All formula fields will need to be copied over from your old base, because only the output values will transfer over as single line text fields. Other calculated fields will also end up also as text fields, since they've lost their source (a record from another table back in the first base).
FAQs
Why should I use a single table with multiple views?
Multiple views with one table allow you to:
Get high-level summaries and gain insights across all views using tools like rollups, the summary bar, and pivot tables.
Use kanban views to move items through stages or steps.
Form responses can feed into one table, then get assigned to the right place by simply changing a field (rather than copying and pasting responses from one table to another).
Create master calendars containing all the information related to a certain class of item and create calendar views filtered to a specific value.
Avoid time-consuming and complicated processes of moving records from one table to another table.
Why should I use multiple tables instead of views?
Multiple tables are helpful beause:
Table names visible along top can make finding what you need more easy and obvious.
Each table will have fewer views associated with it, making view navigation within each table easier.