Plan Availability | All paid plans |
Permissions |
|
Platform(s) | Web/Browser, Mac app, and Windows app |
Adding the flowchart extension
Open your Airtable home screen.
Create or open the base where you want to install the flowchart extension.
Click Tools in the upper-right corner.
Click the Extensions option.
Click Add an extension.
Search for and locate the flowchart extension.
Click Add, then Add extension.
Getting started with the Flowchart extension
The flowchart extension creates flowcharts from records in a chosen table. By setting up record dependencies—records that link to other records in the same table—the extension will automatically build a flowchart based on your choices. You can even save your flowcharts as PNG and SVG files for printing, sharing, or further editing.
The flowchart extension requires a base with the following:
A table with a linked record field that links to records in that same table.
Only collaborators with editor access and above can configure the flowchart settings. Collaborators with commenter or read-only permissions can still view and export the chart.
Optional: color-coded records (if you want the flowchart to mirror the colors of your records).
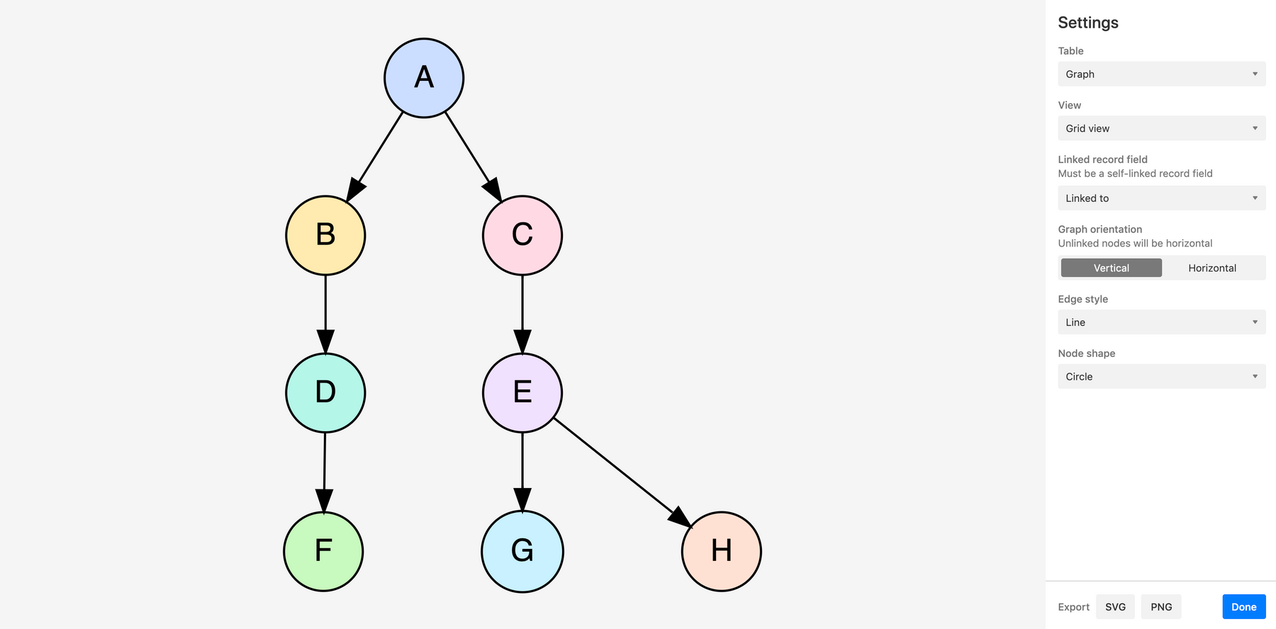
The flowchart extension has three primary settings you'll need to adjust to get started:
Table: Choose the table you want to work with to build the flowchart. Make sure the table you choose has the linked record field that links to other records in this same table.
View: Choose any view in the table you selected in the previous setting. You can choose all records or a filtered view you've created that only displays a selection of records.
Linked-record field: Choose the linked record field in this table that links to other records in the same table. The flowchart extension will automatically build your flowchart from the contents of this field.
The flowchart extension also has a few optional settings that can adjust the appearance of your flowchart:
Chart orientation: This setting allows you to set the orientation of your chart. When you have a wide chart, the horizontal setting works best. Conversely, you'll want to use the vertical setting for taller charts to maximize their size in the extension's display area. Naturally, most flow charts will look best in full screen with the optimal orientation selected. You can always adjust this setting on the fly if your needs change.
Link style: Choose "Right angles" if you want flow chart lines that only flow in orthogonal directions and turn at perfect right angles. Alternatively, choose "Straight lines" if you want the flowchart's lines to flow the shortest distance between records in the chart, resulting in both orthogonal and diagonal paths.
Record shape: You can choose the shape that displays the contents of the primary field of each record with this setting. By default, records appear as rounded rectangles but you can also choose (non-rounded) rectangles, ellipses, circles, and diamonds.
Understanding how the flowchart extension works
Watch this demonstration of a simple setup for the flowchart extension to get an idea of how it works and read on for additional information.
Once you've satisfied the settings for the flowchart extension, you can begin adding records and links in your chosen table.
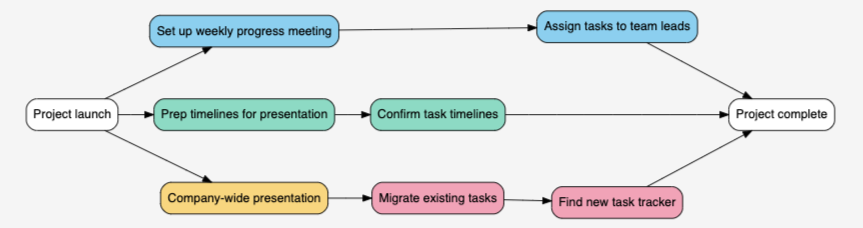
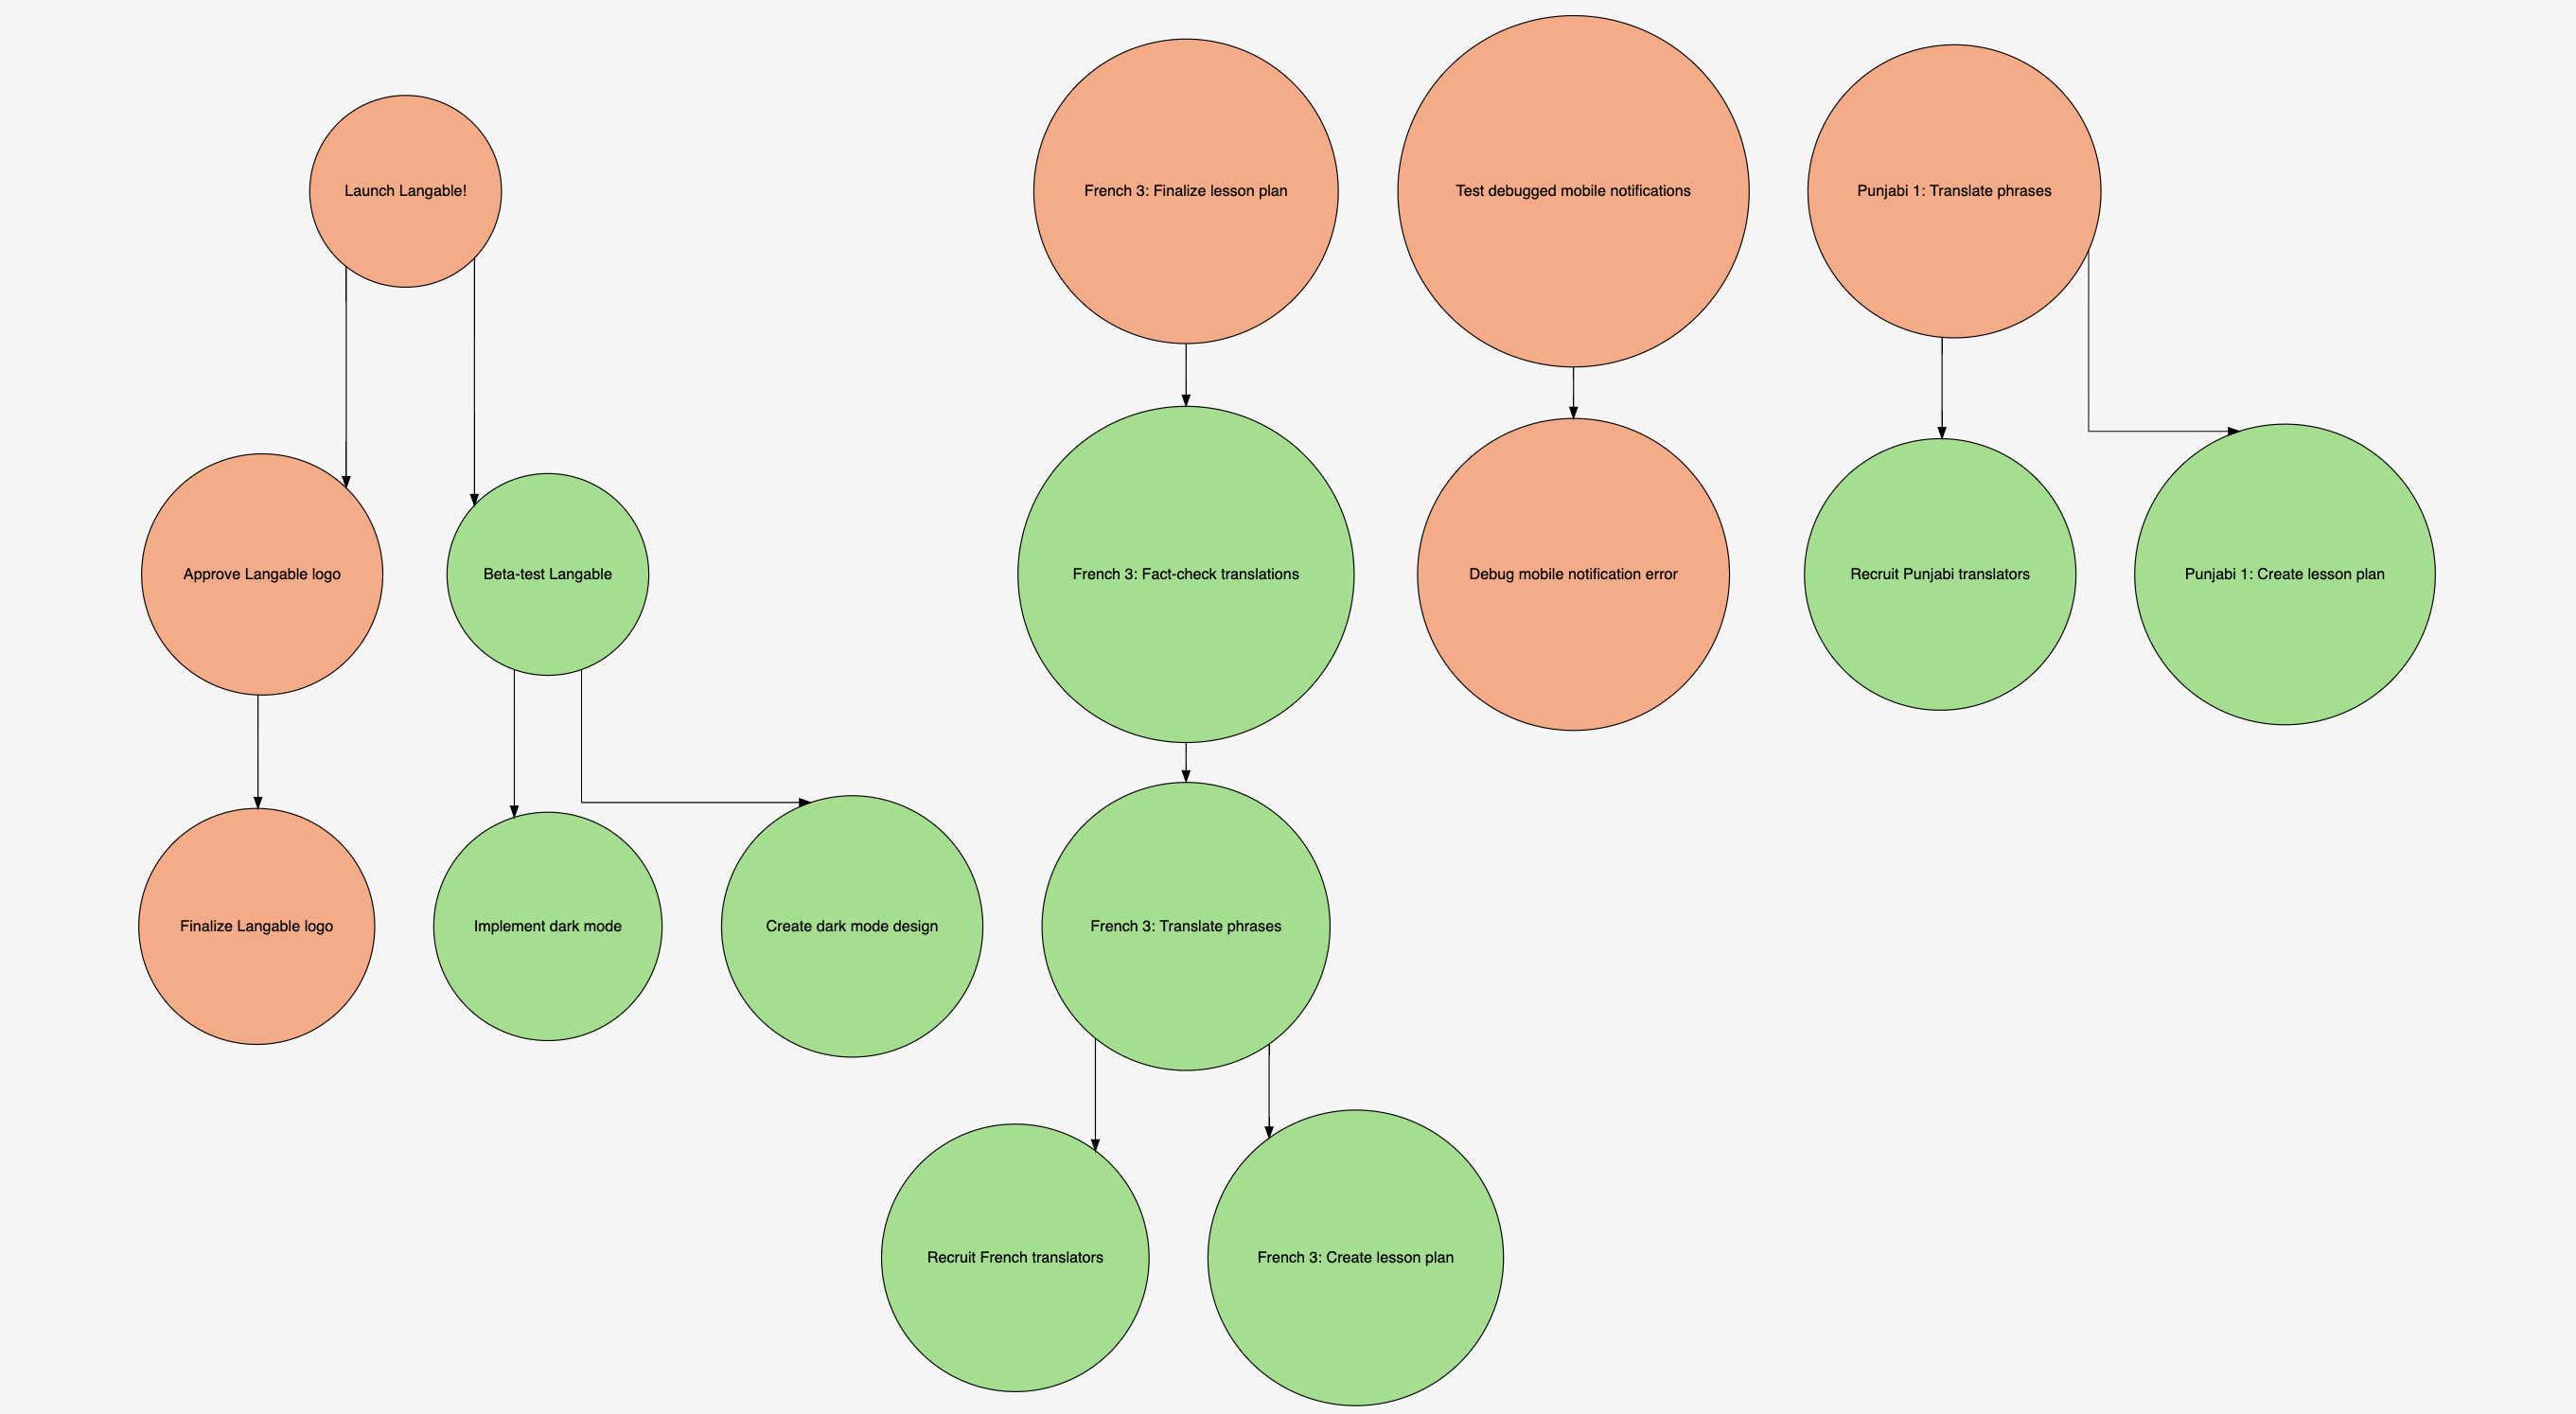
As demonstrated in the example above, the flowchart extension forms its flowchart automatically when one record links to another in the same table. If a record called "A" links to two other records called "B" and "C" (respectively), you'll see the flowchart draw an arrow from the "A" record to the "B" and "C" records.
Whenever you choose a record and link other records to it, the flowchart extension draws an arrow from the original to the linked record (or records).
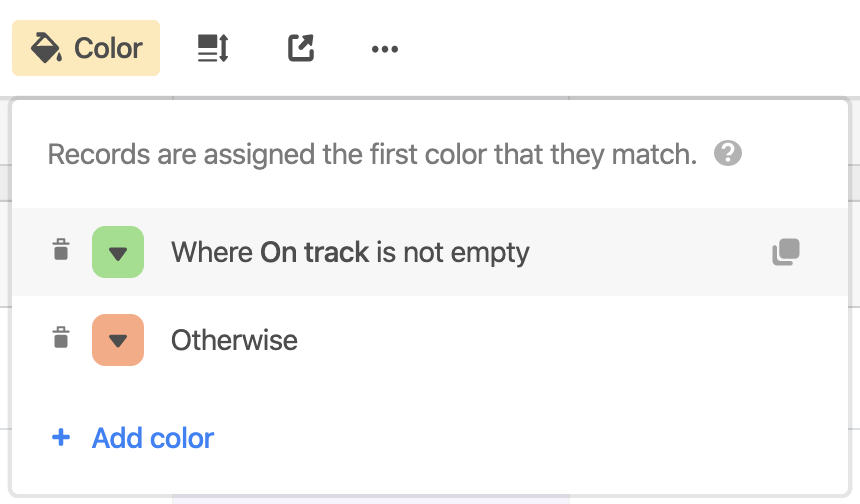
By default, the flowchart displays all records in white but you can change this by color-coding your records.
Once you make your selections, the flowchart extension immediately updates to reflect that selection.
You can export your flowcharts as PNG and SVG files whenever you wish by clicking the corresponding export button at the bottom of the extension.
![]()
PNG files are great for digitally sharing your flowchart or embedding it in presentations. SVG files work best when you want to make additional edits to the flowchart in another application like Adobe Illustrator and/or print your flowchart at any resolution without a loss of image quality.
FAQs
Is there a limitation to the number of records that the flowchart extension can display?
Yes. For display compatibility, only 100 records can be displayed per flowchart extension.
Can I use multiple shapes in my flowchart?
You can choose from multiple shapes in the settings of your flowchart but you cannot use more than one shape at a time.
How do I make changes to the flowchart?
You cannot make changes to the corresponding records directly from the flowchart extension. Changes and additions must take place in the table you chose when setting it up.
How can I adjust the layout of the flowchart?
You can change your flowchart's orientation, link style, and record shape by adjusting the optional settings described in this support article. The flowchart extension automatically calculates all other aspects of the layout.
How do I change the size of the flowchart?
The flowchart extension always fills up the maximum amount of space possible based on the orientation of the chart. Charts with several records will often look small when docked in an extensions dashboard so make sure to select the fullscreen option when you want to display them in the largest size possible.
Also, ensure you've set the flowchart's optimal orientation. Wider charts will fill more space in the horizontal orientation while taller charts will fill more space in the vertical orientation. You can find detailed descriptions of these settings earlier in this support article.
If you export your flowchart as an SVG file (described earlier in this support article) you can make adjustments in any application with SVG support (e.g. Adobe Illustrator) which, of course, includes resizing the chart to any resolution you need.