Plan availability | All paid plans |
Permissions |
|
Platform(s) | Web/Browser, Mac app, Windows app, and some basic functionality on iOS and Android mobile apps |
Using view settings
After you've installed and configured the Gantt view, there are a number of ways you can interact with records and customize the appearance.
As with any view, there are a number of ways that you can customize records and their appearance within the view. For Gantt, you can use filtering, grouping, and record colors to customize each individual Gantt view in your base.
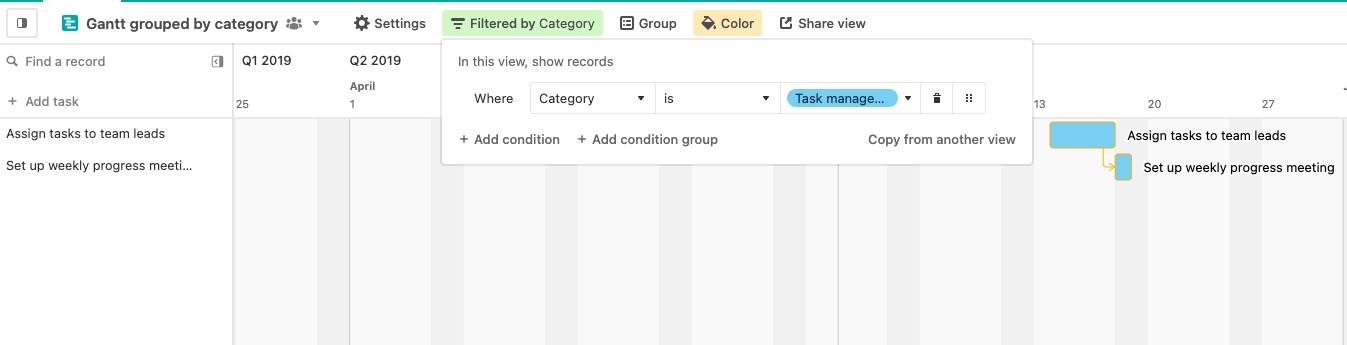
Filtering
Filtering records via conditions allows you to only show some of the records in the table within your Gantt view. To filter out records, click on the "Filter" icon just above the Gantt chart.

For more in-depth guidance on filtering views, see this article.
Grouping
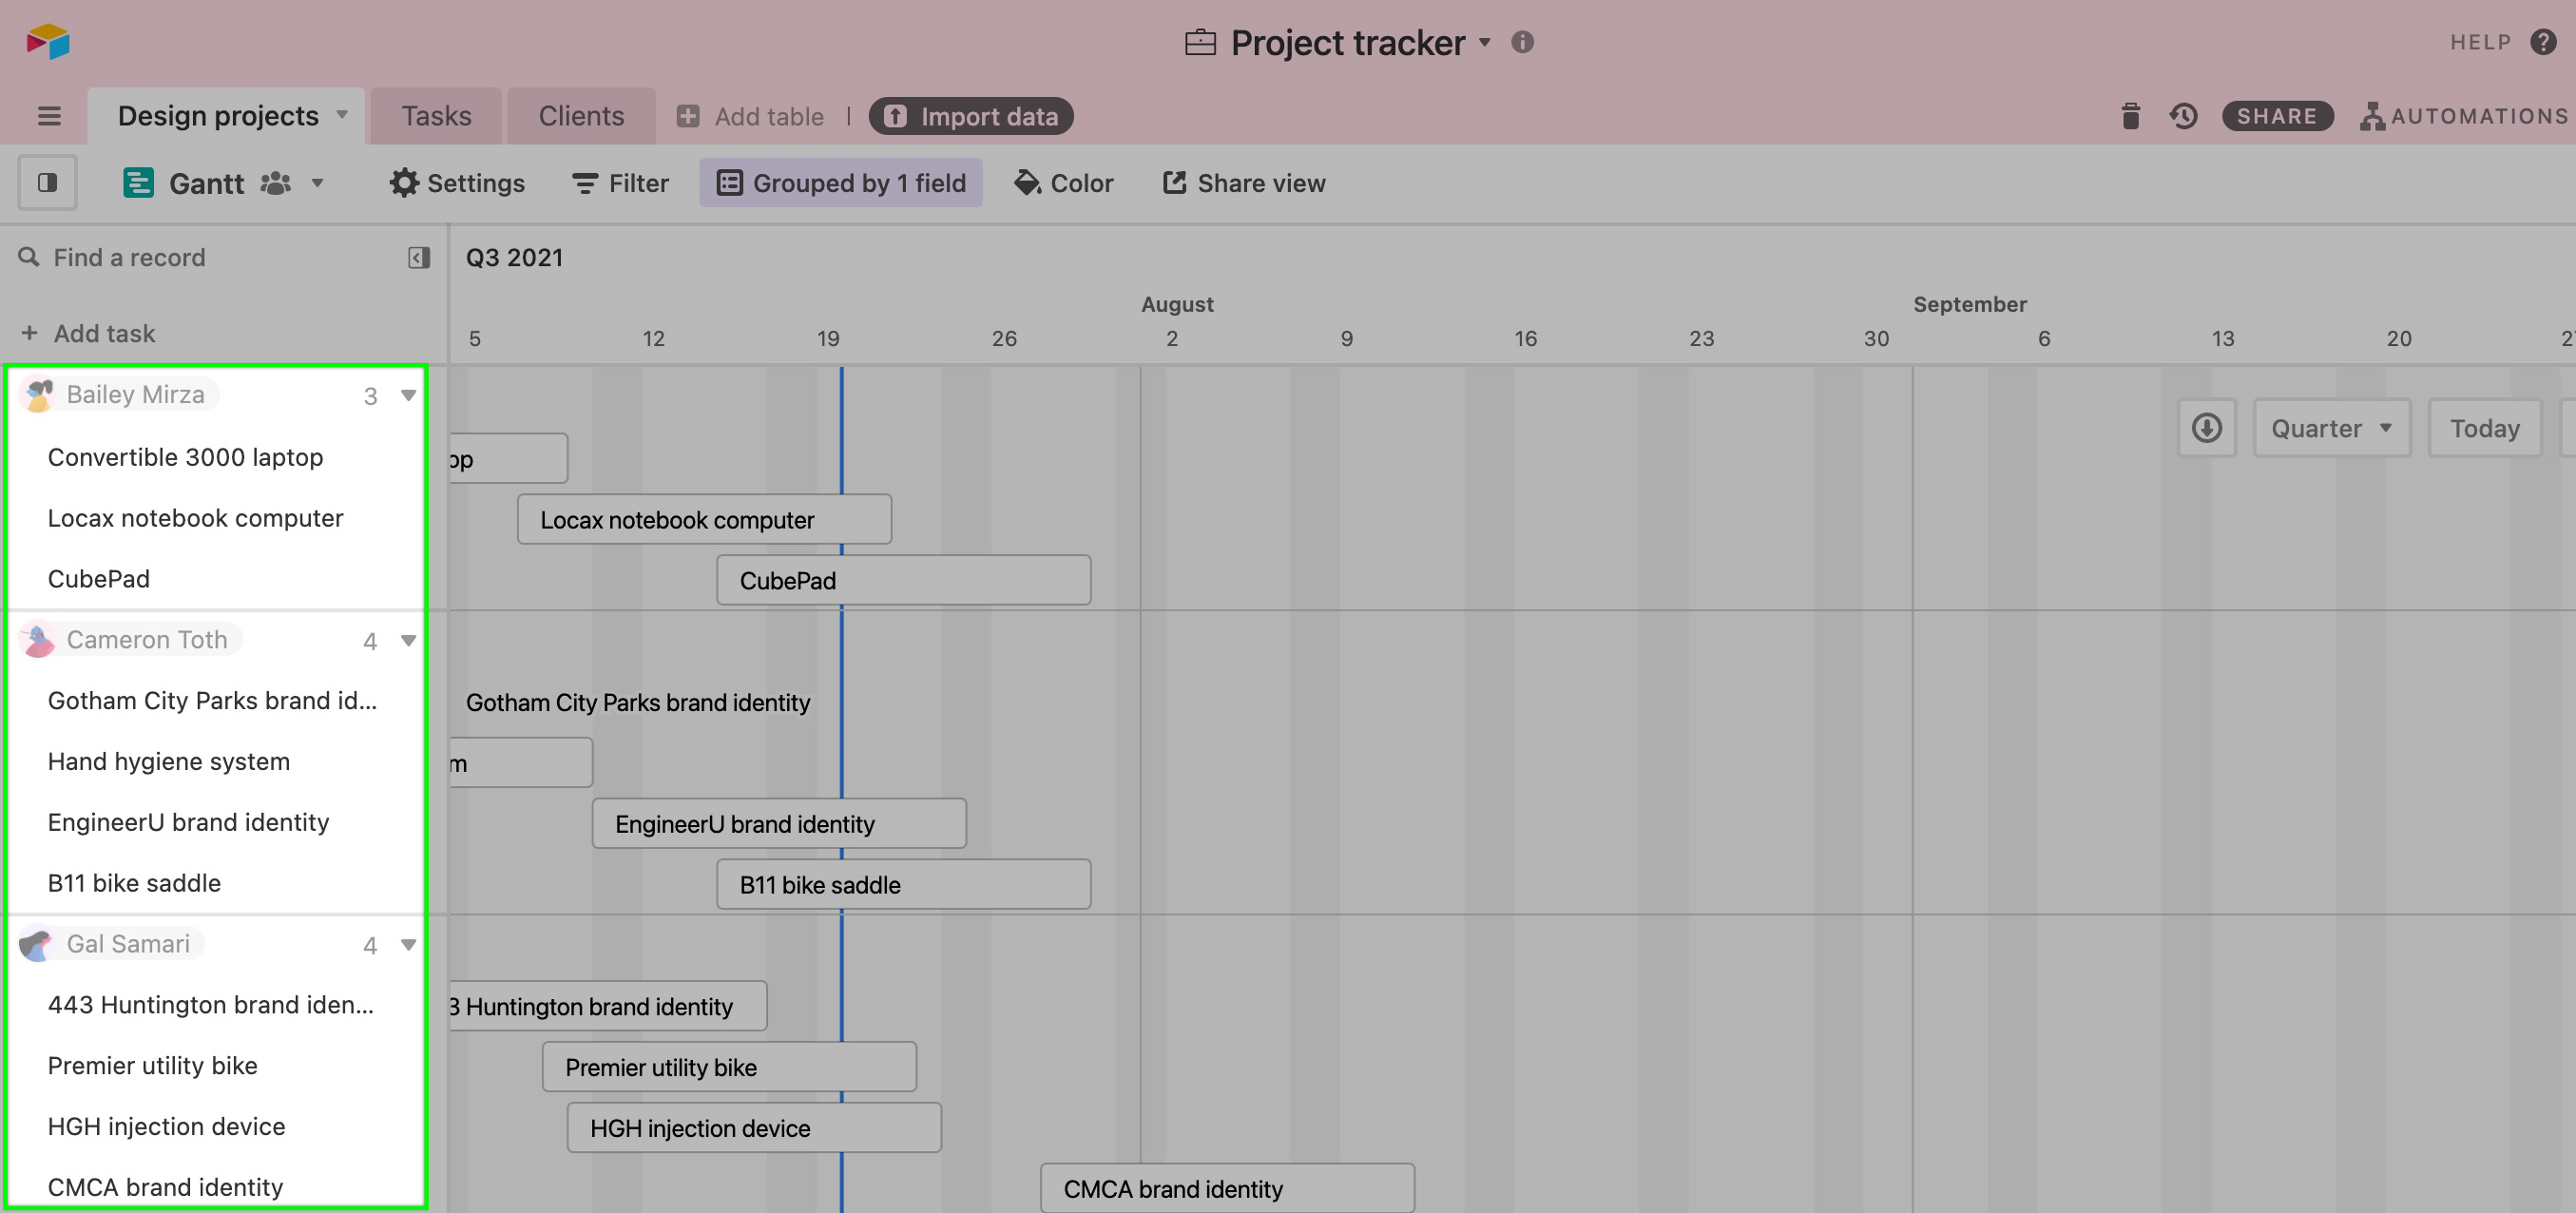
You can choose fields from a dropdown menu that you can use to group your records. Groups can be expanded and collapsed in the left hand sidebar. This can be used in a number of ways, e.g. grouping by project and phase, team and assignee, or assignee and status. 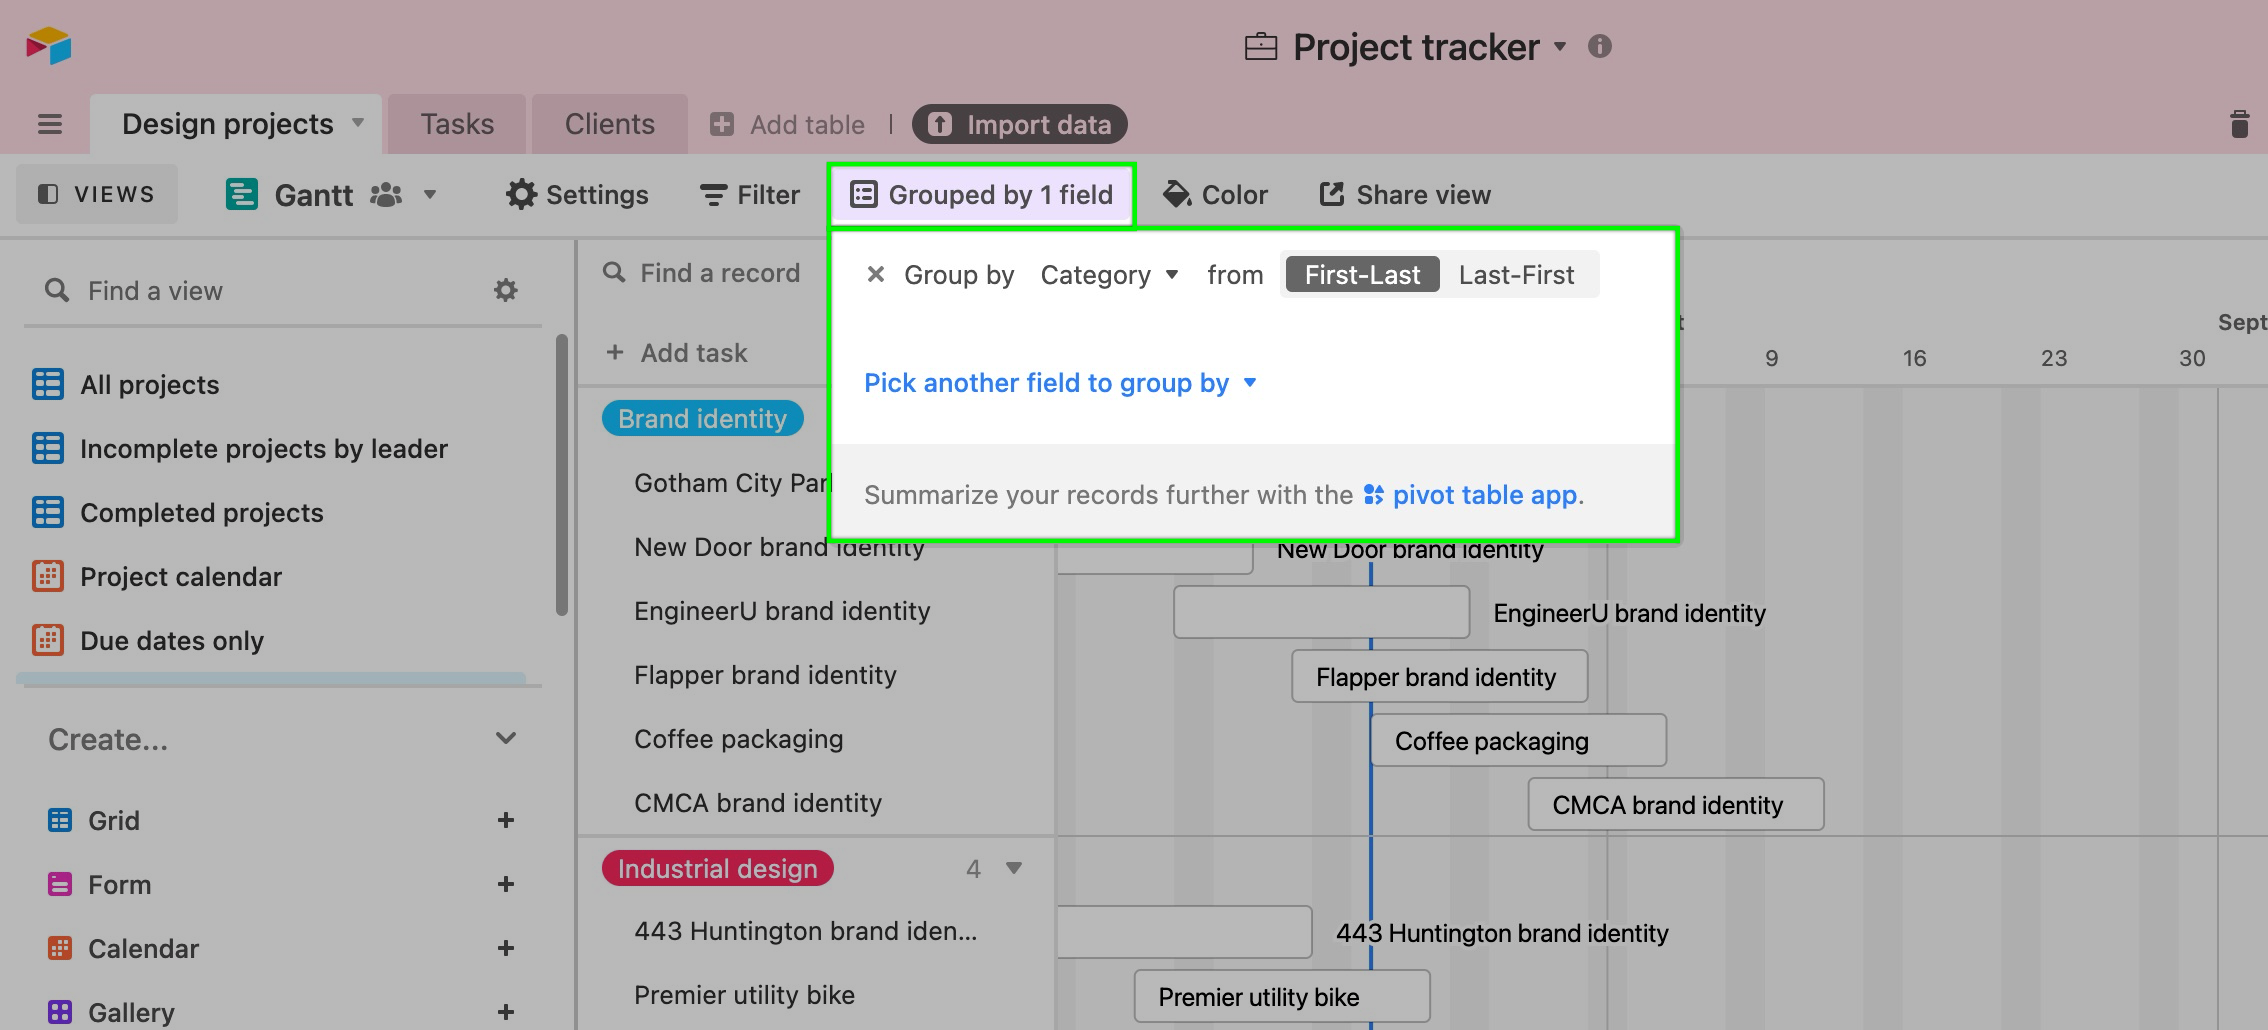
Much like grouping in grid views, when you group records that share the same value in a specified field they will be visually grouped together in the Gantt view. For example, if different collaborators are responsible for different tasks, you could group by a collaborator field to more easily see all of the tasks assigned to specific individuals.
Note that this setting currently supports up to 3 levels of grouping.
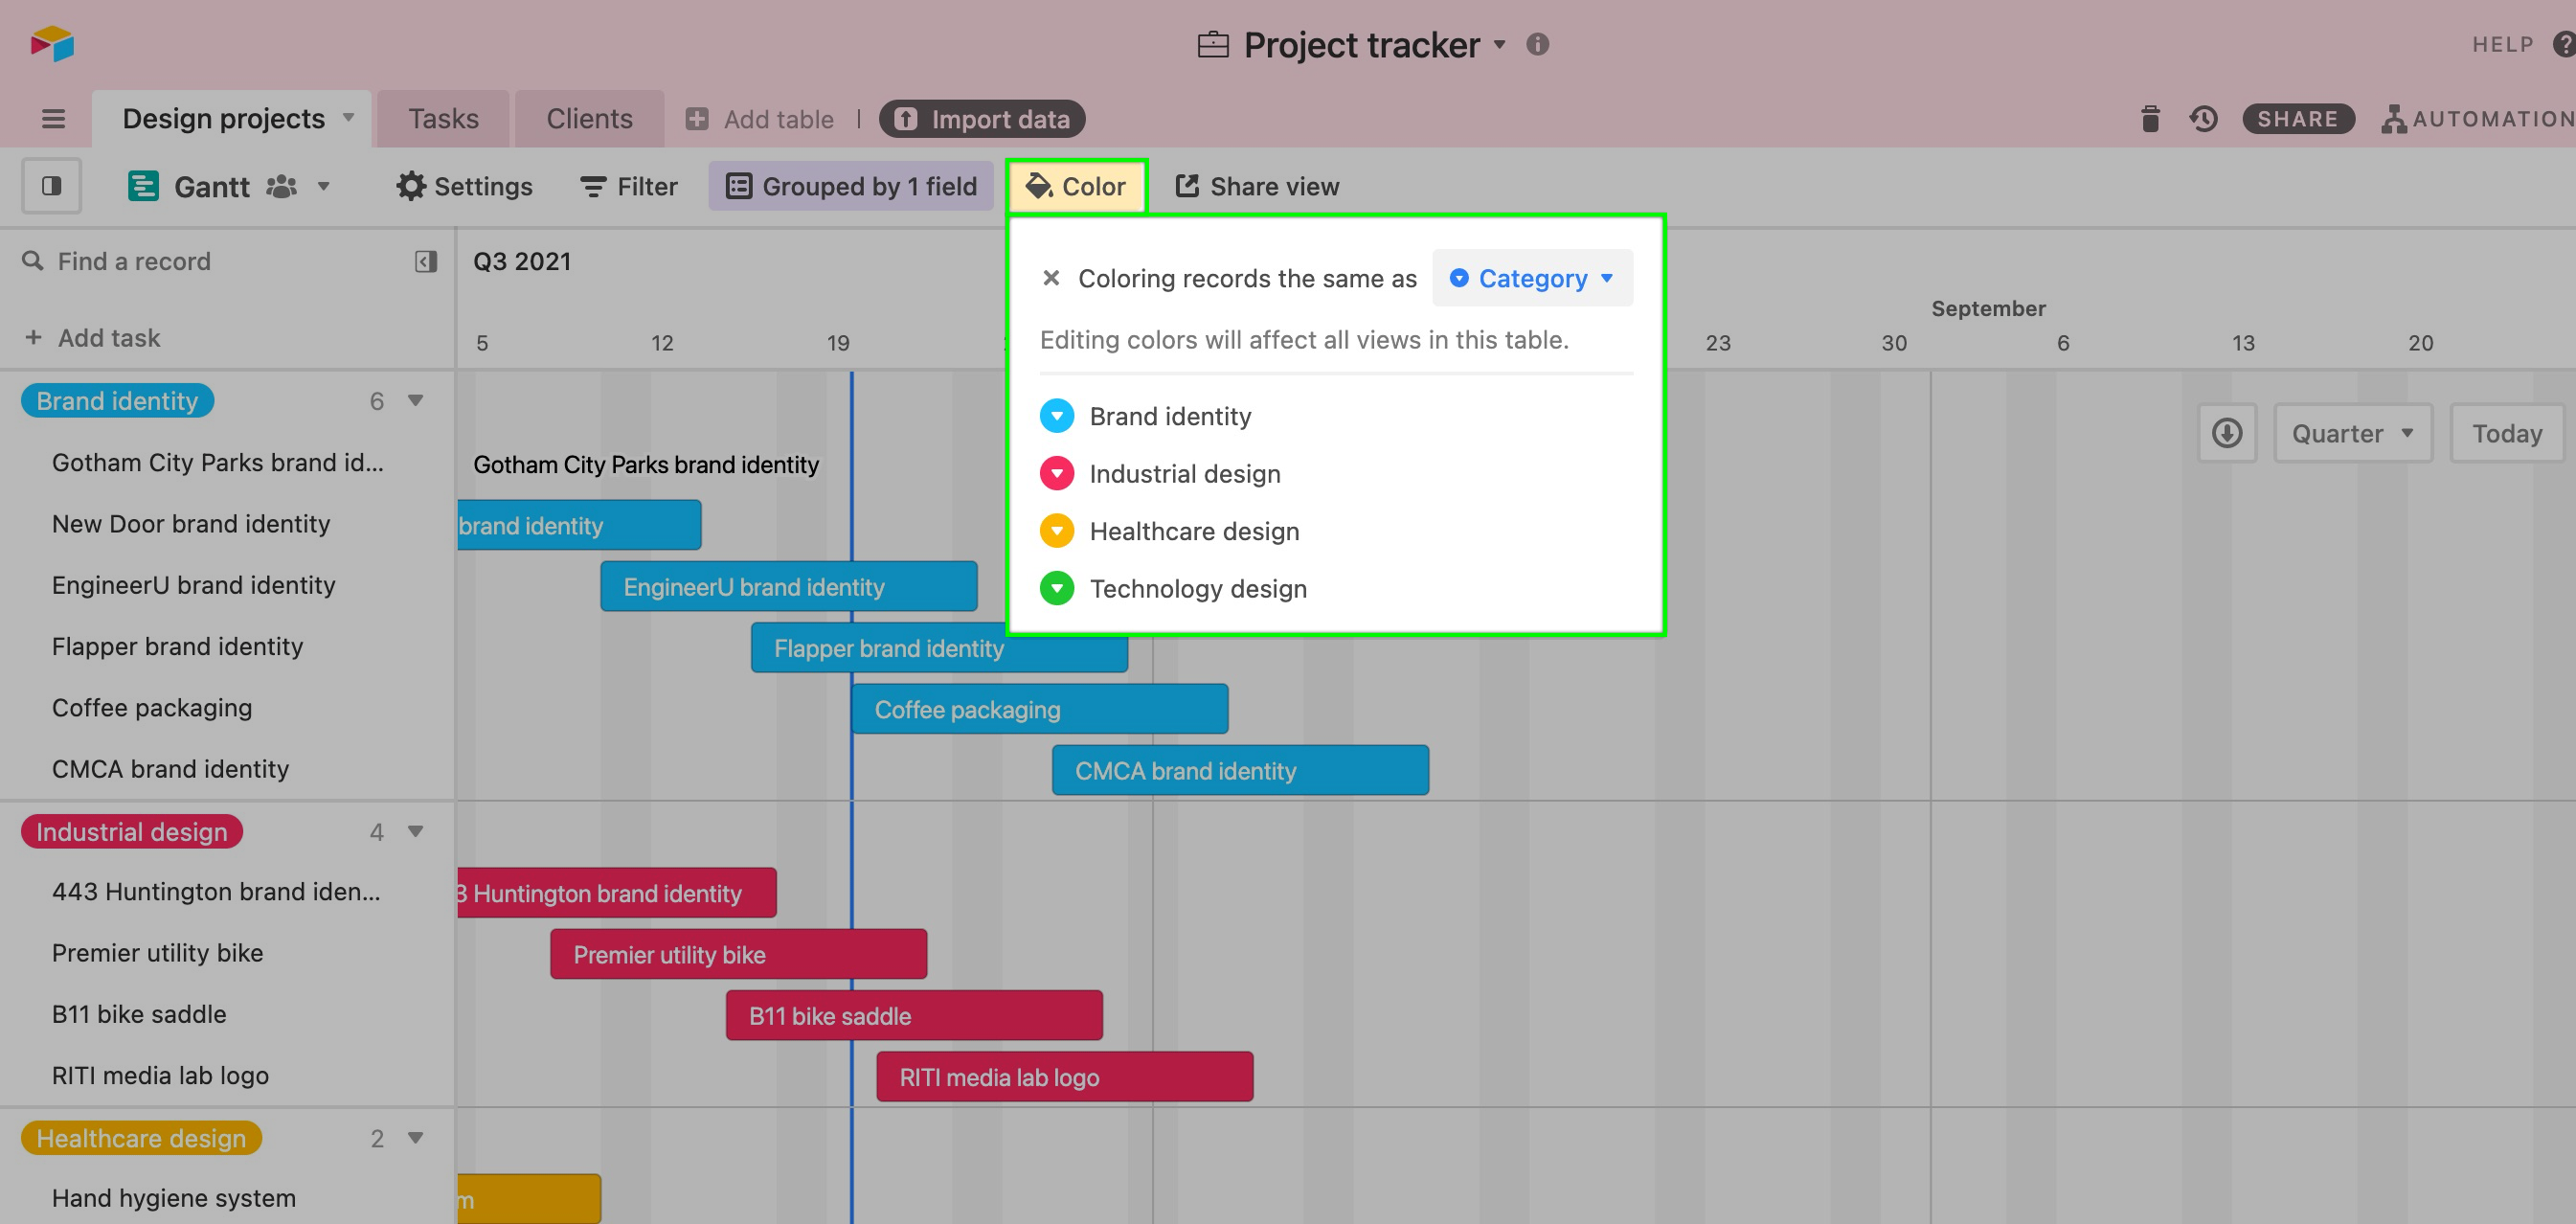
Record color
You can customize the color of the records in your Gantt chart by using the "Record color" settings. There are three options to choose from:
Specific color will give all your records the same color of your choosing.
By view can be used if you have conditional record coloring setup in the view you're using to define your Gantt chart. This setting will apply those record colors to your Gantt chart.
By select field will apply colors to your records based on the token colors used in a single select field of your choosing.
Change date range
You can change the date range on the horizontal axis by clicking the dropdown menu to the left of the Today button. The arrows let you shift your view backward or forward by the currently selected date range.
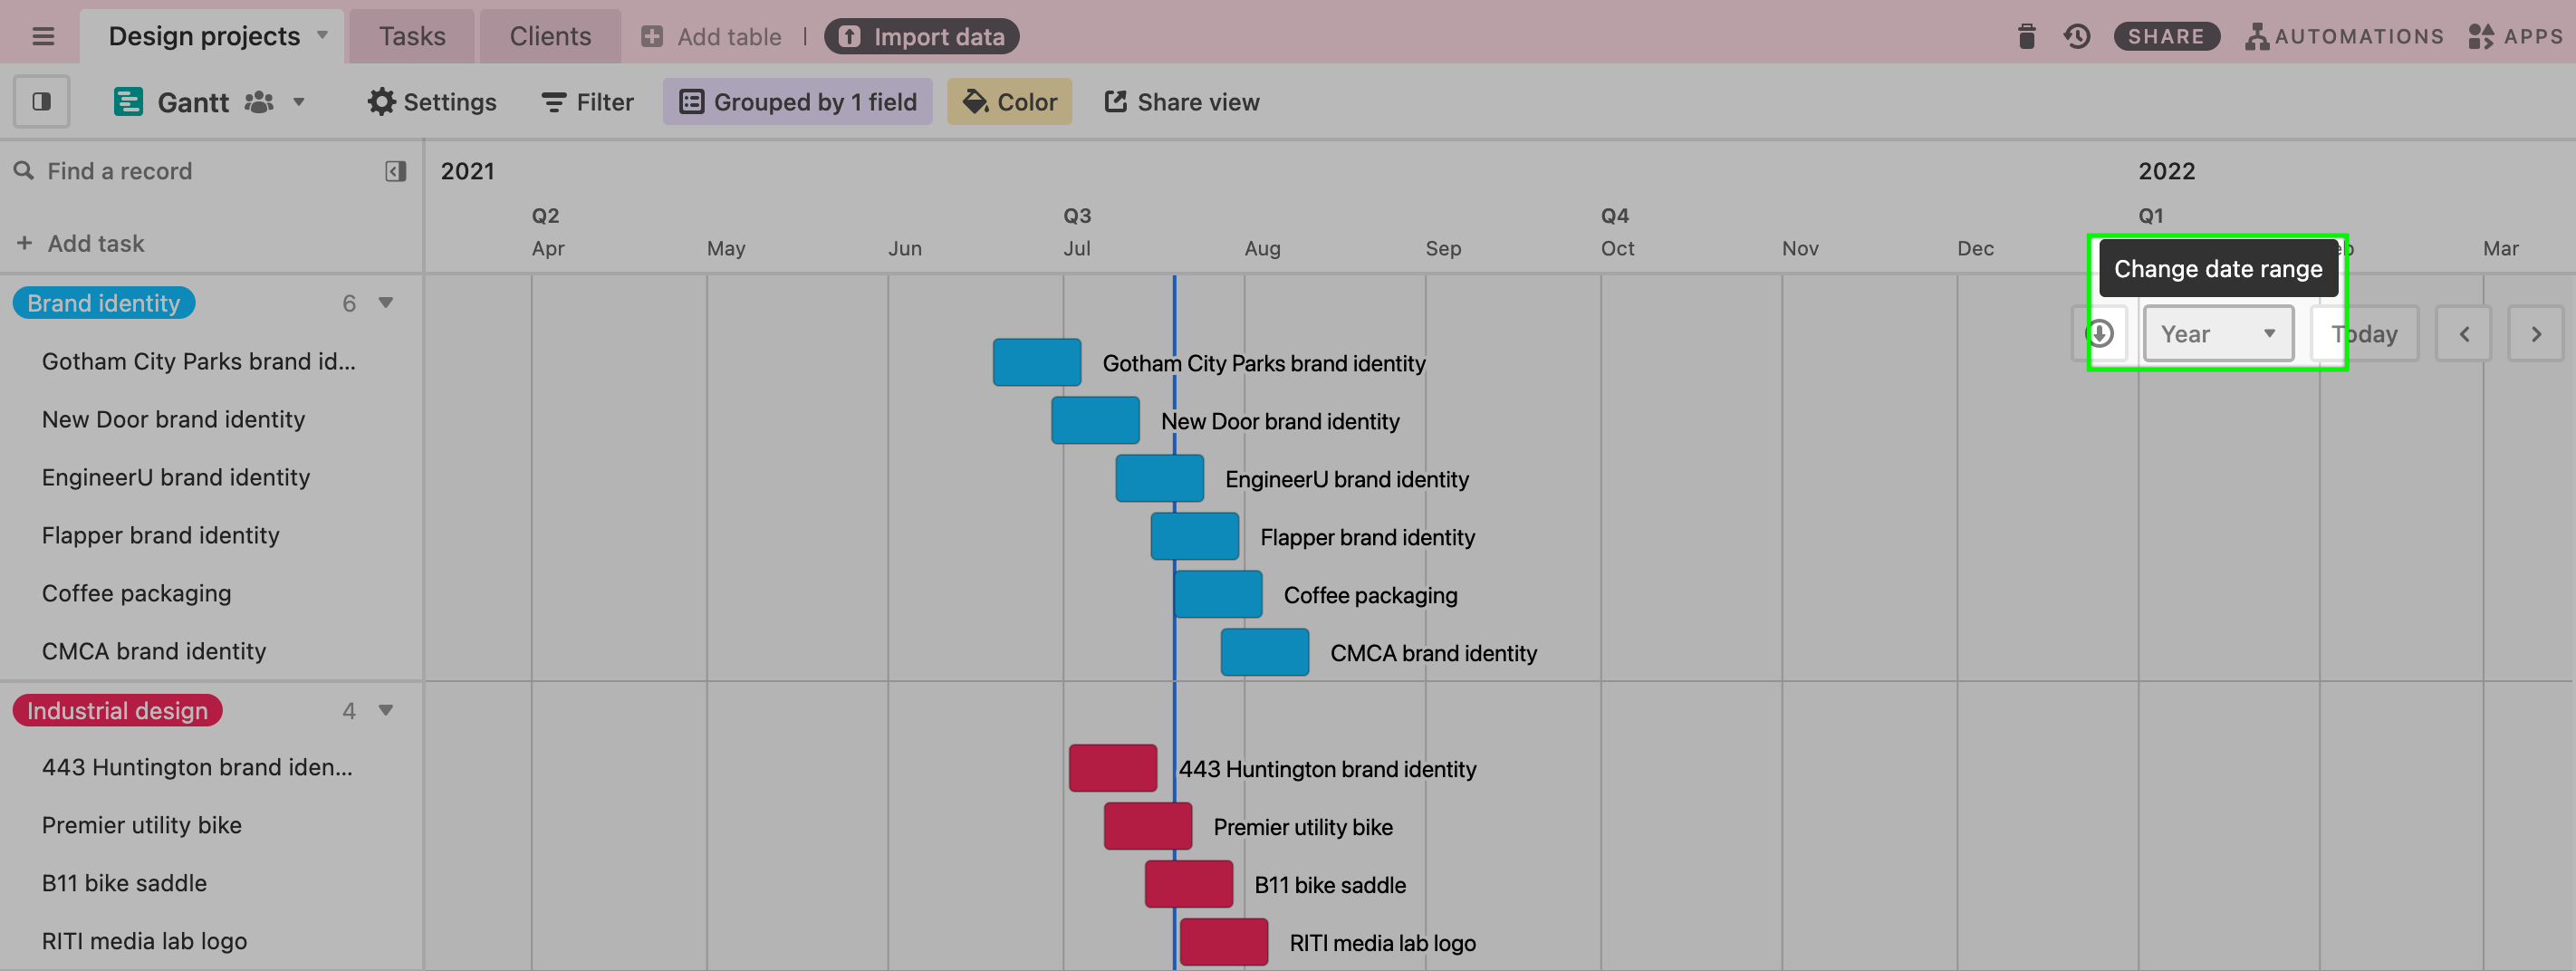
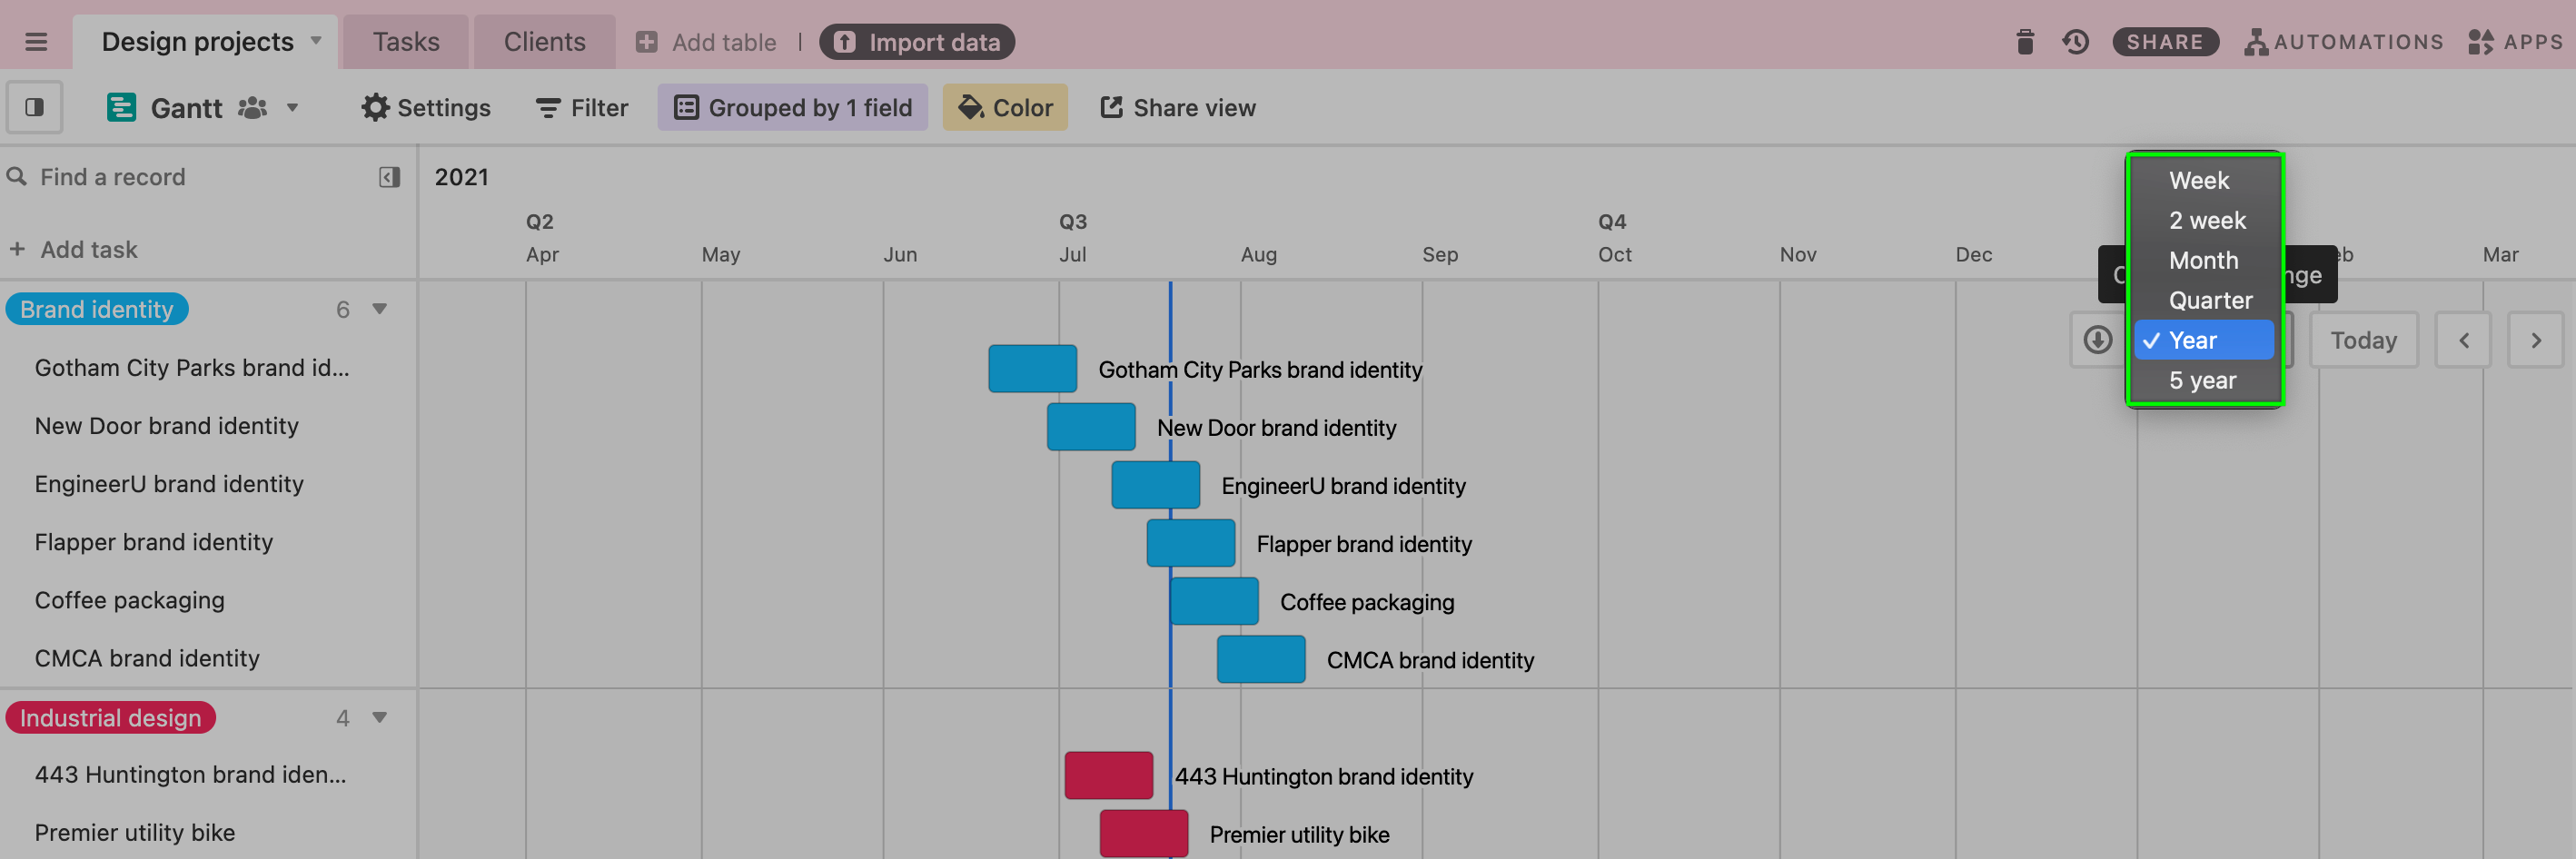
There are 6 options you can choose from: a week, 2 weeks, a month, a quarter, a year, or 5 years.
To navigate records within the chosen date range, you can scroll left and right using the scroll bar toward the bottom of the chart, and scroll up and down using the scroll bar to the right of the chart.
Calendar dates are indicated by vertical lines on the chart, with today's date is indicated by a thick blue vertical line. Thin gray lines indicate the end of one month and the beginning of another month. Weekends appear as slightly darker gray vertical slices on the chart when the date range is a month, 2 weeks, or a week.
Date visibility
By clicking on the "Settings" option near the upper left corner of the Gantt view you can set up the date visibility options. The first option is to choose whether to show "All calendar days" or "Only workdays." It's important to note that this feature currently assumes a Monday-Friday workweek, so Saturdays and Sundays will not be visible when the "Only workdays" option is used.
Additionally, when the "Only workdays" option is turned on the ability to hide certain holidays will appear.
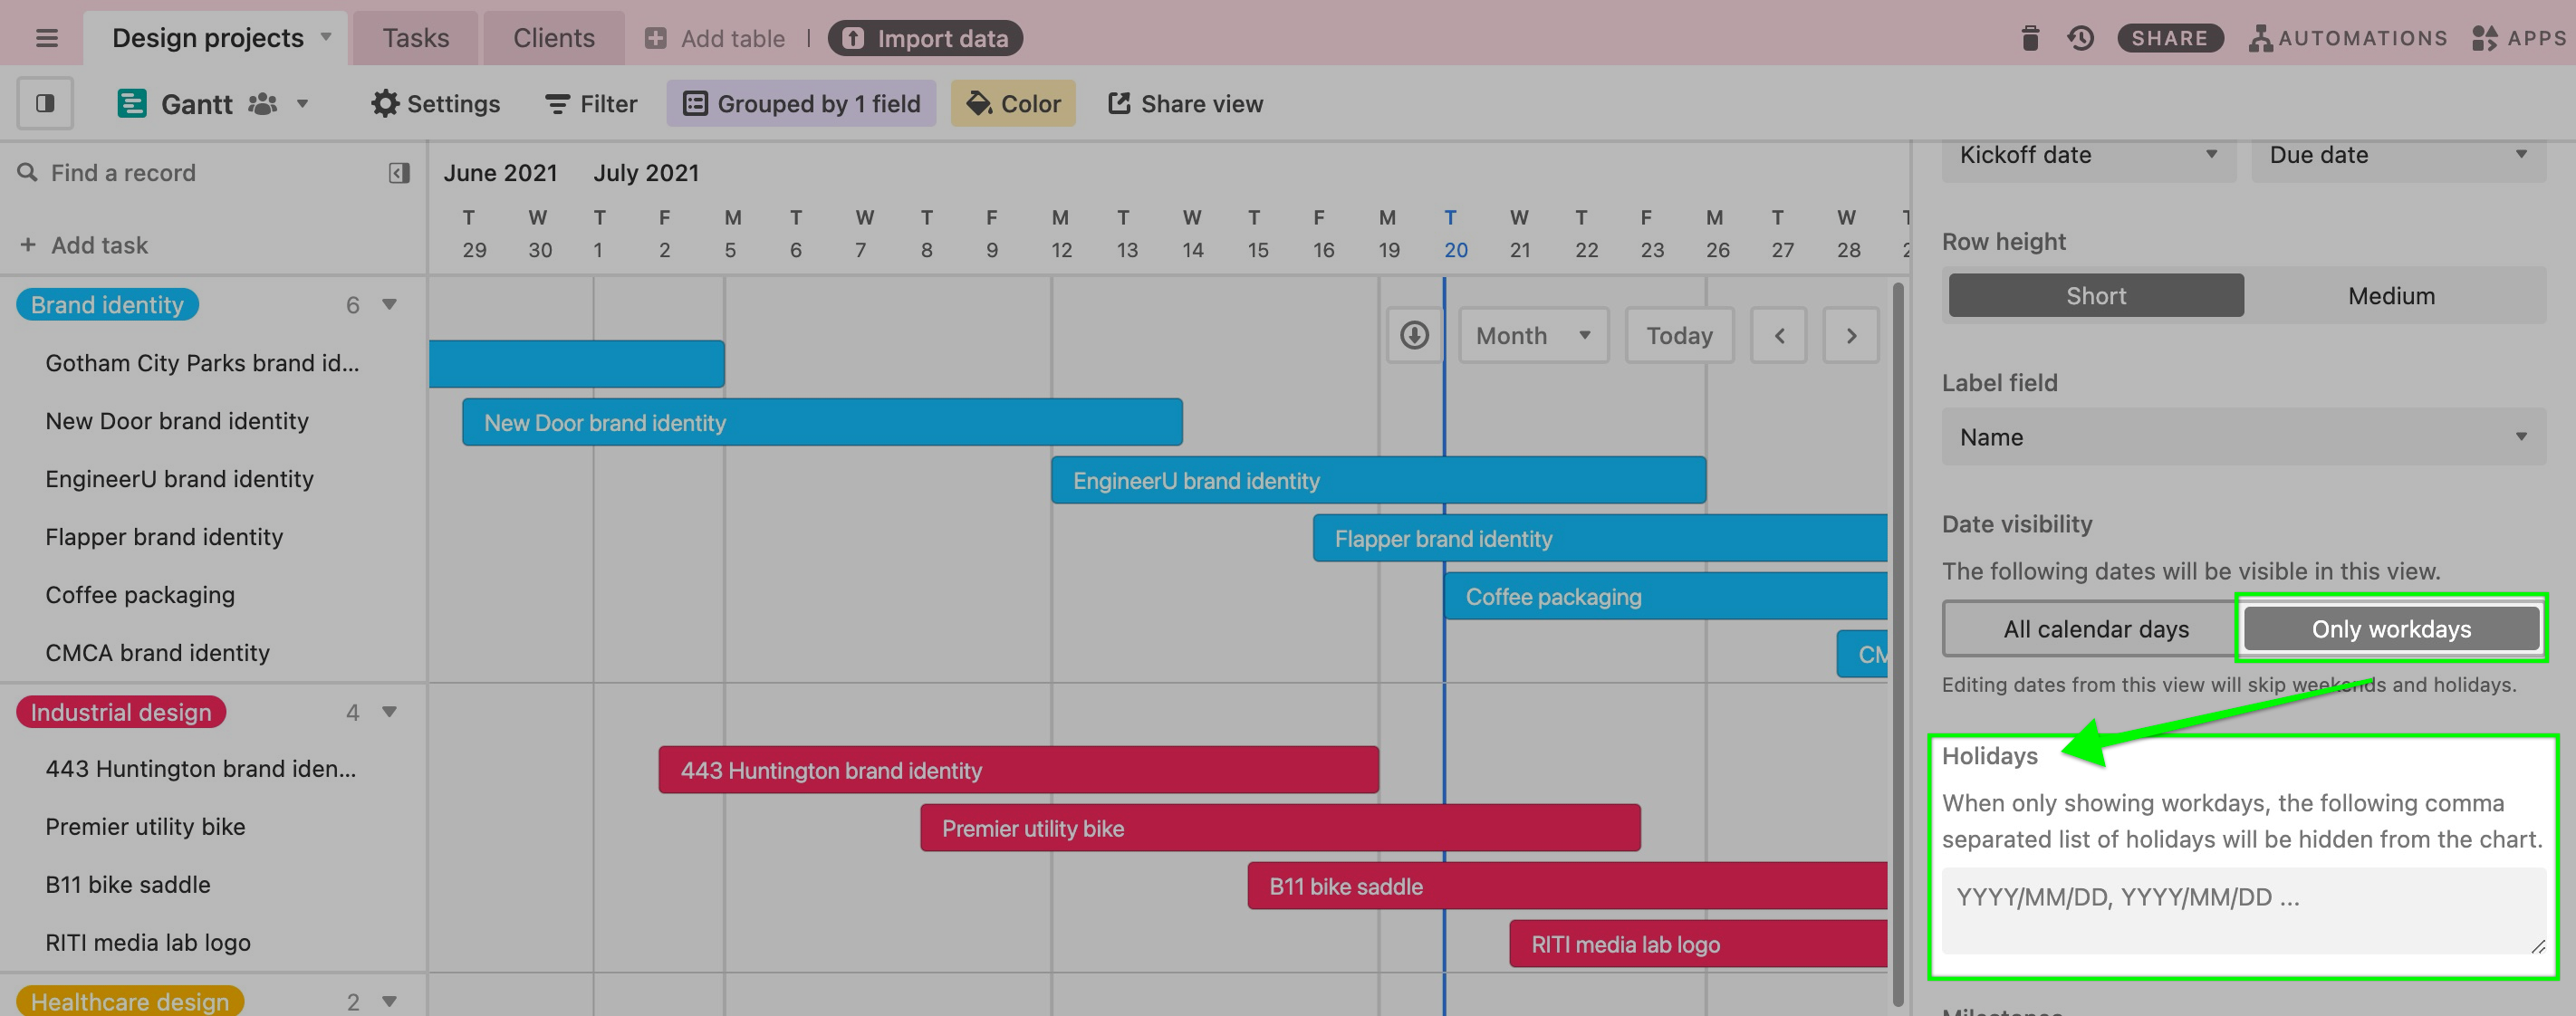
It's important to add holidays in the YYYY/MM/DD format and separate each date with a comma. Alternatively, you can use the Calendar that pops up to add dates that you would like the Gantt view to not show.
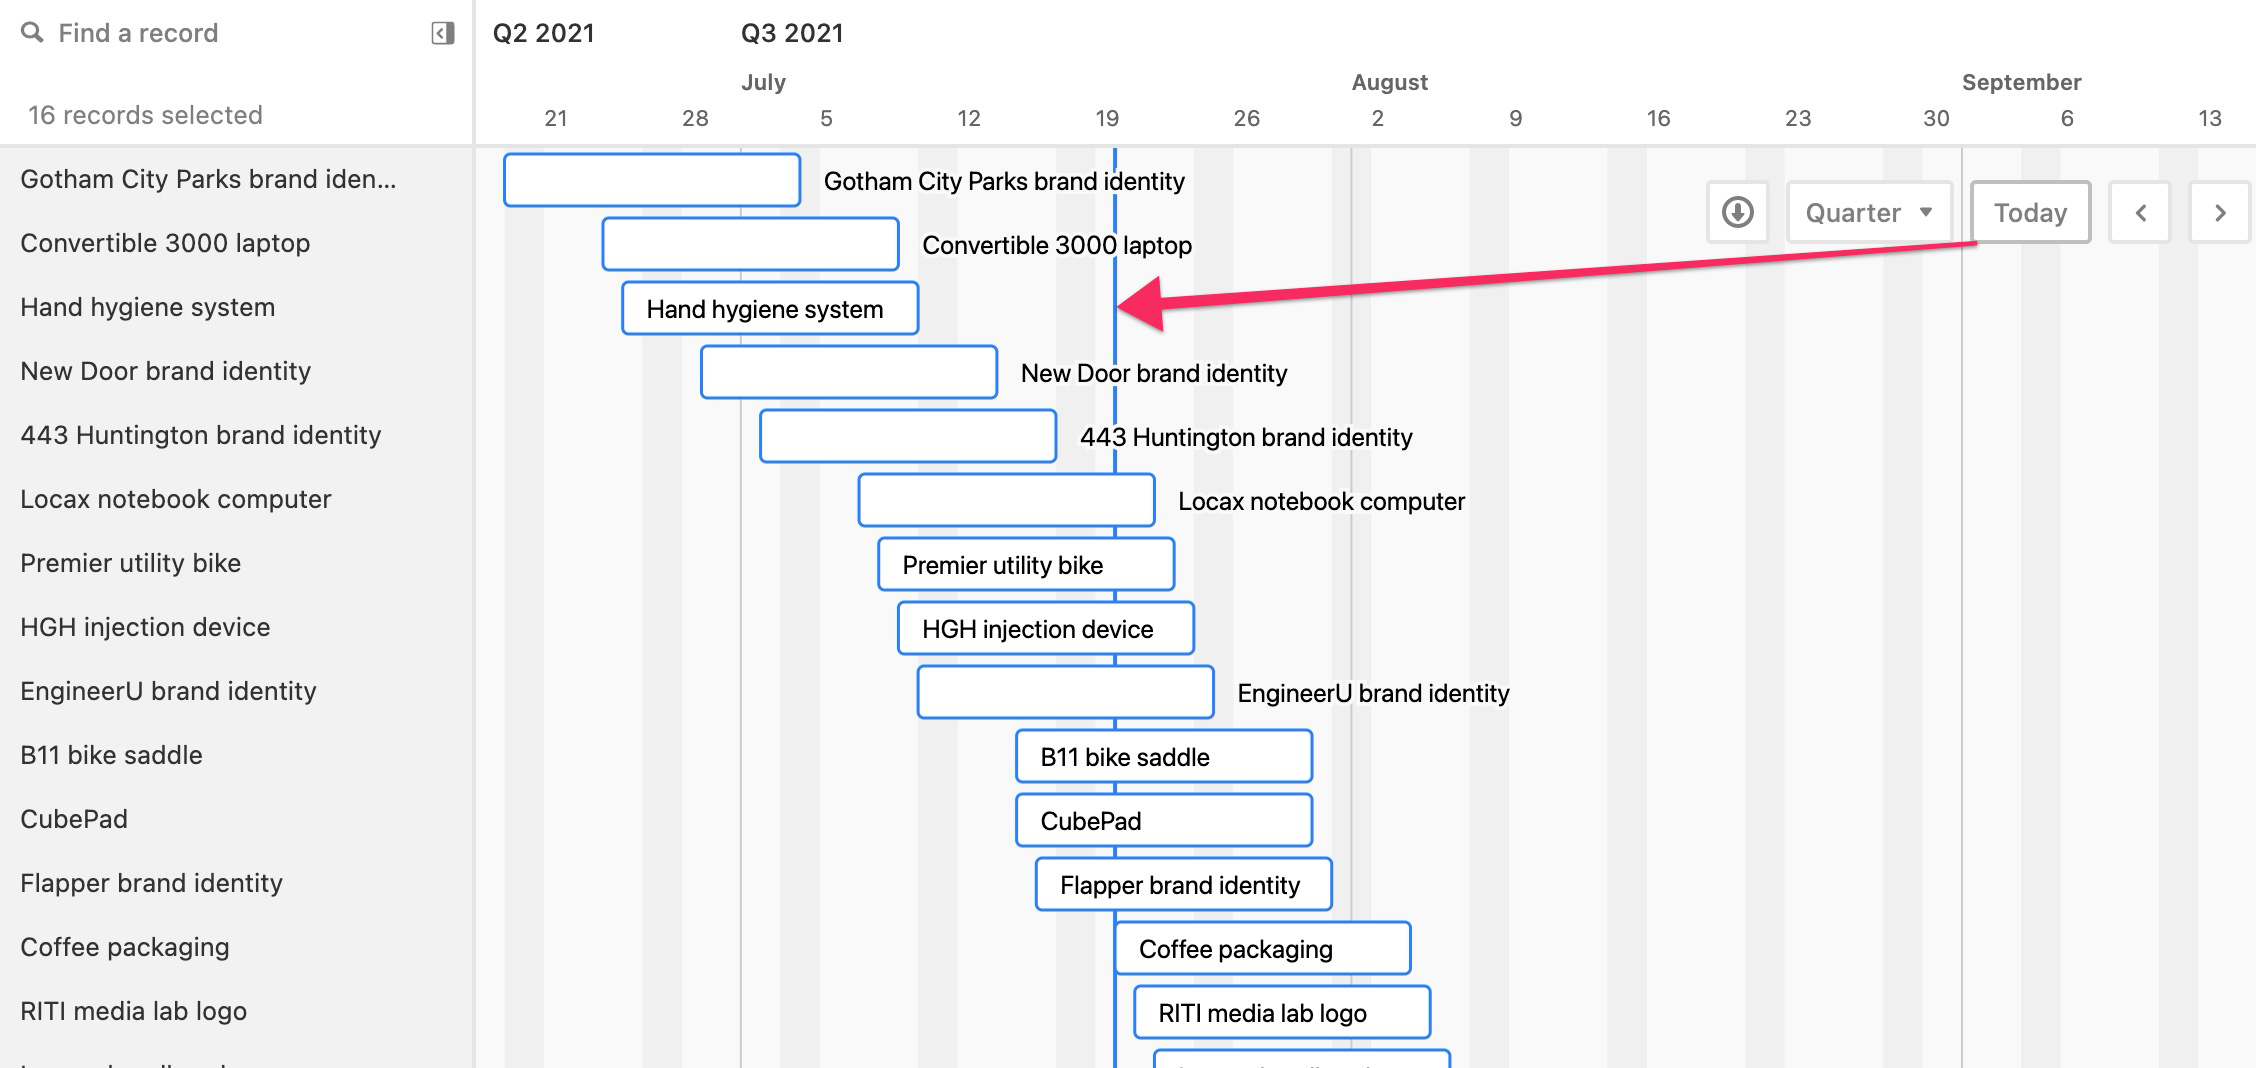
Jump to today
To easily view records on or around the current date, click the "Today" button near the top-right of the Gantt view.
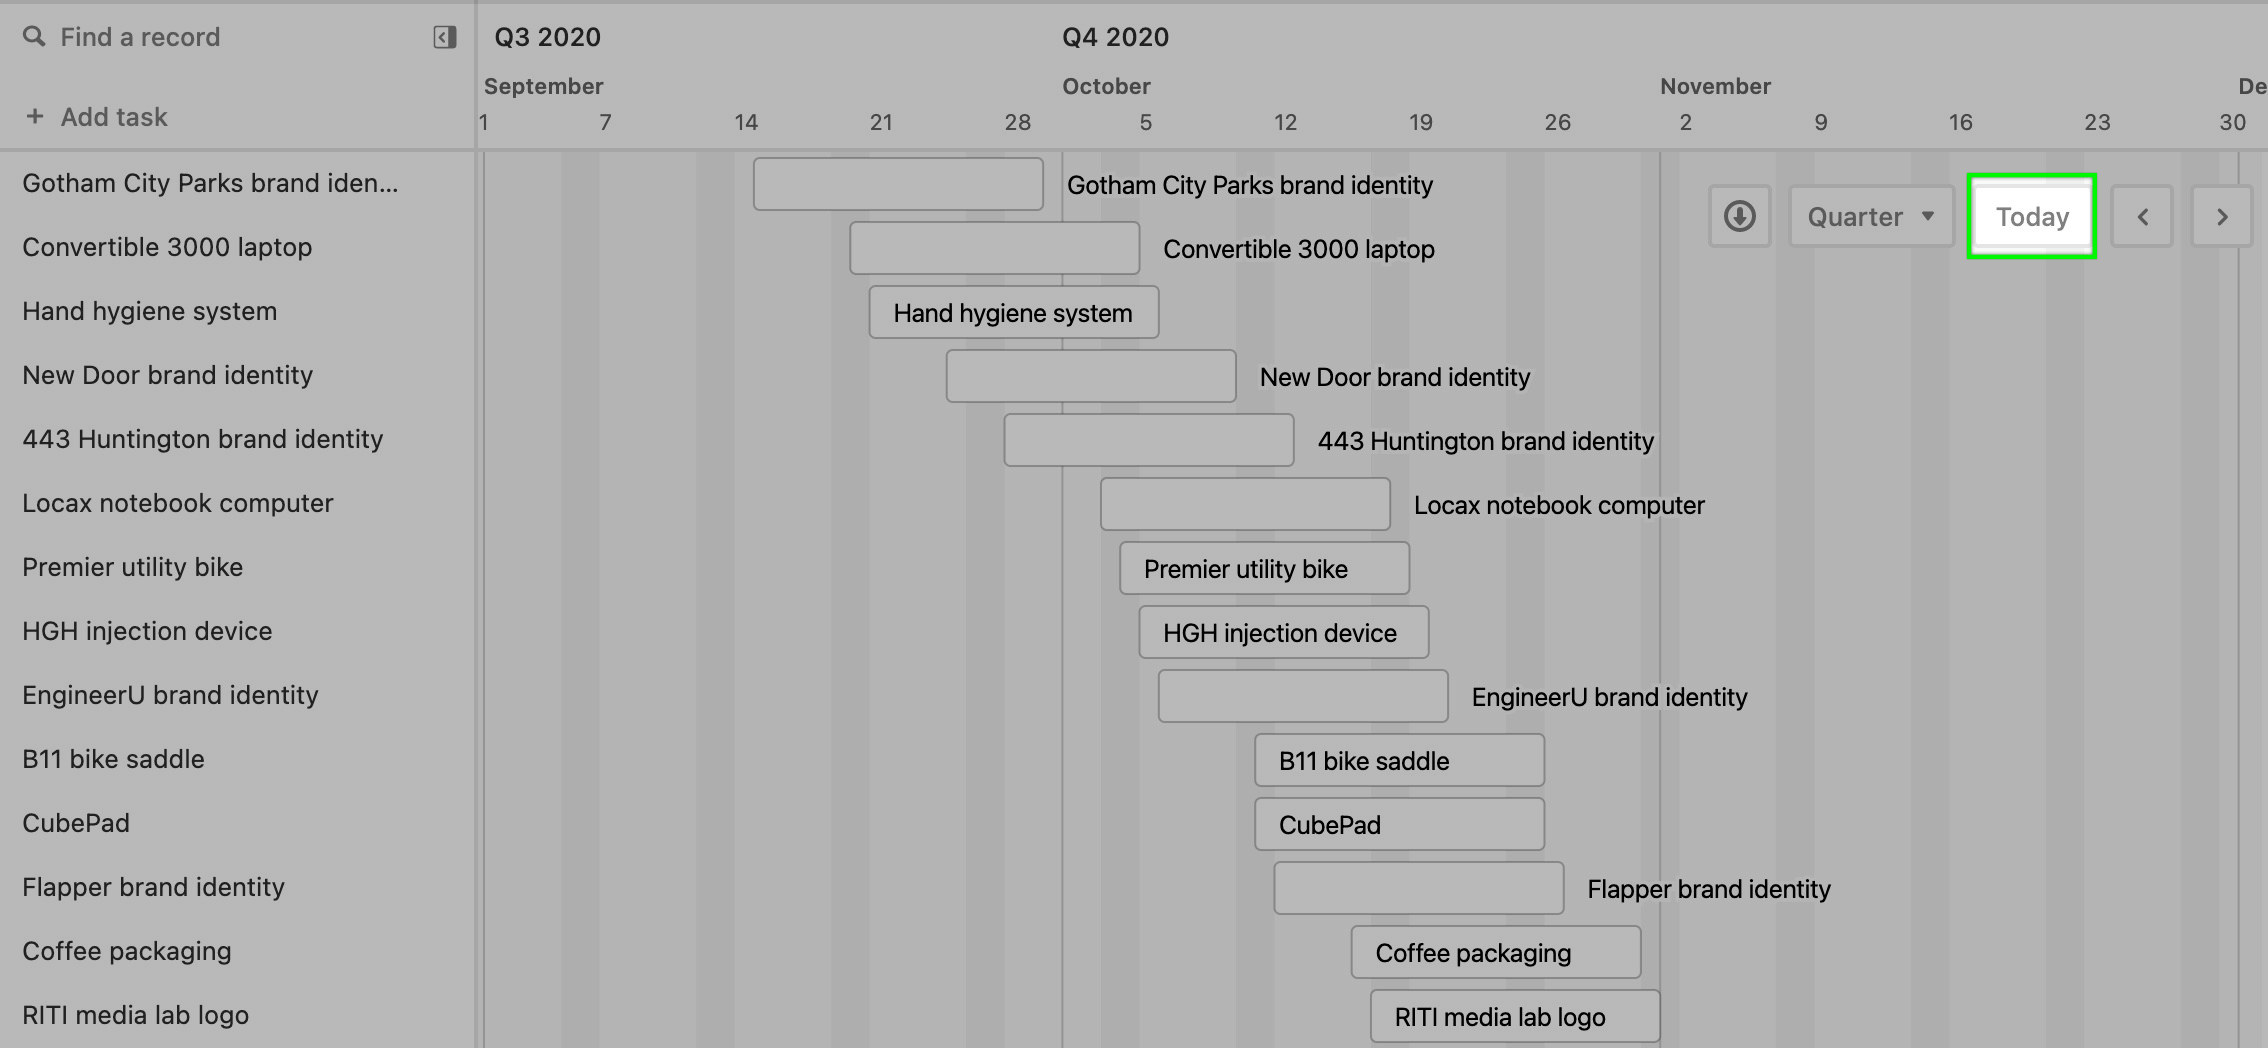
When you click "Today", the chart will scroll today's date into view and indicate it with a blue vertical line.
Navigating forward and backward
Another way to navigate the Gantt chart is to shift the visible records forward and backward using the arrows near the top-right of the view.
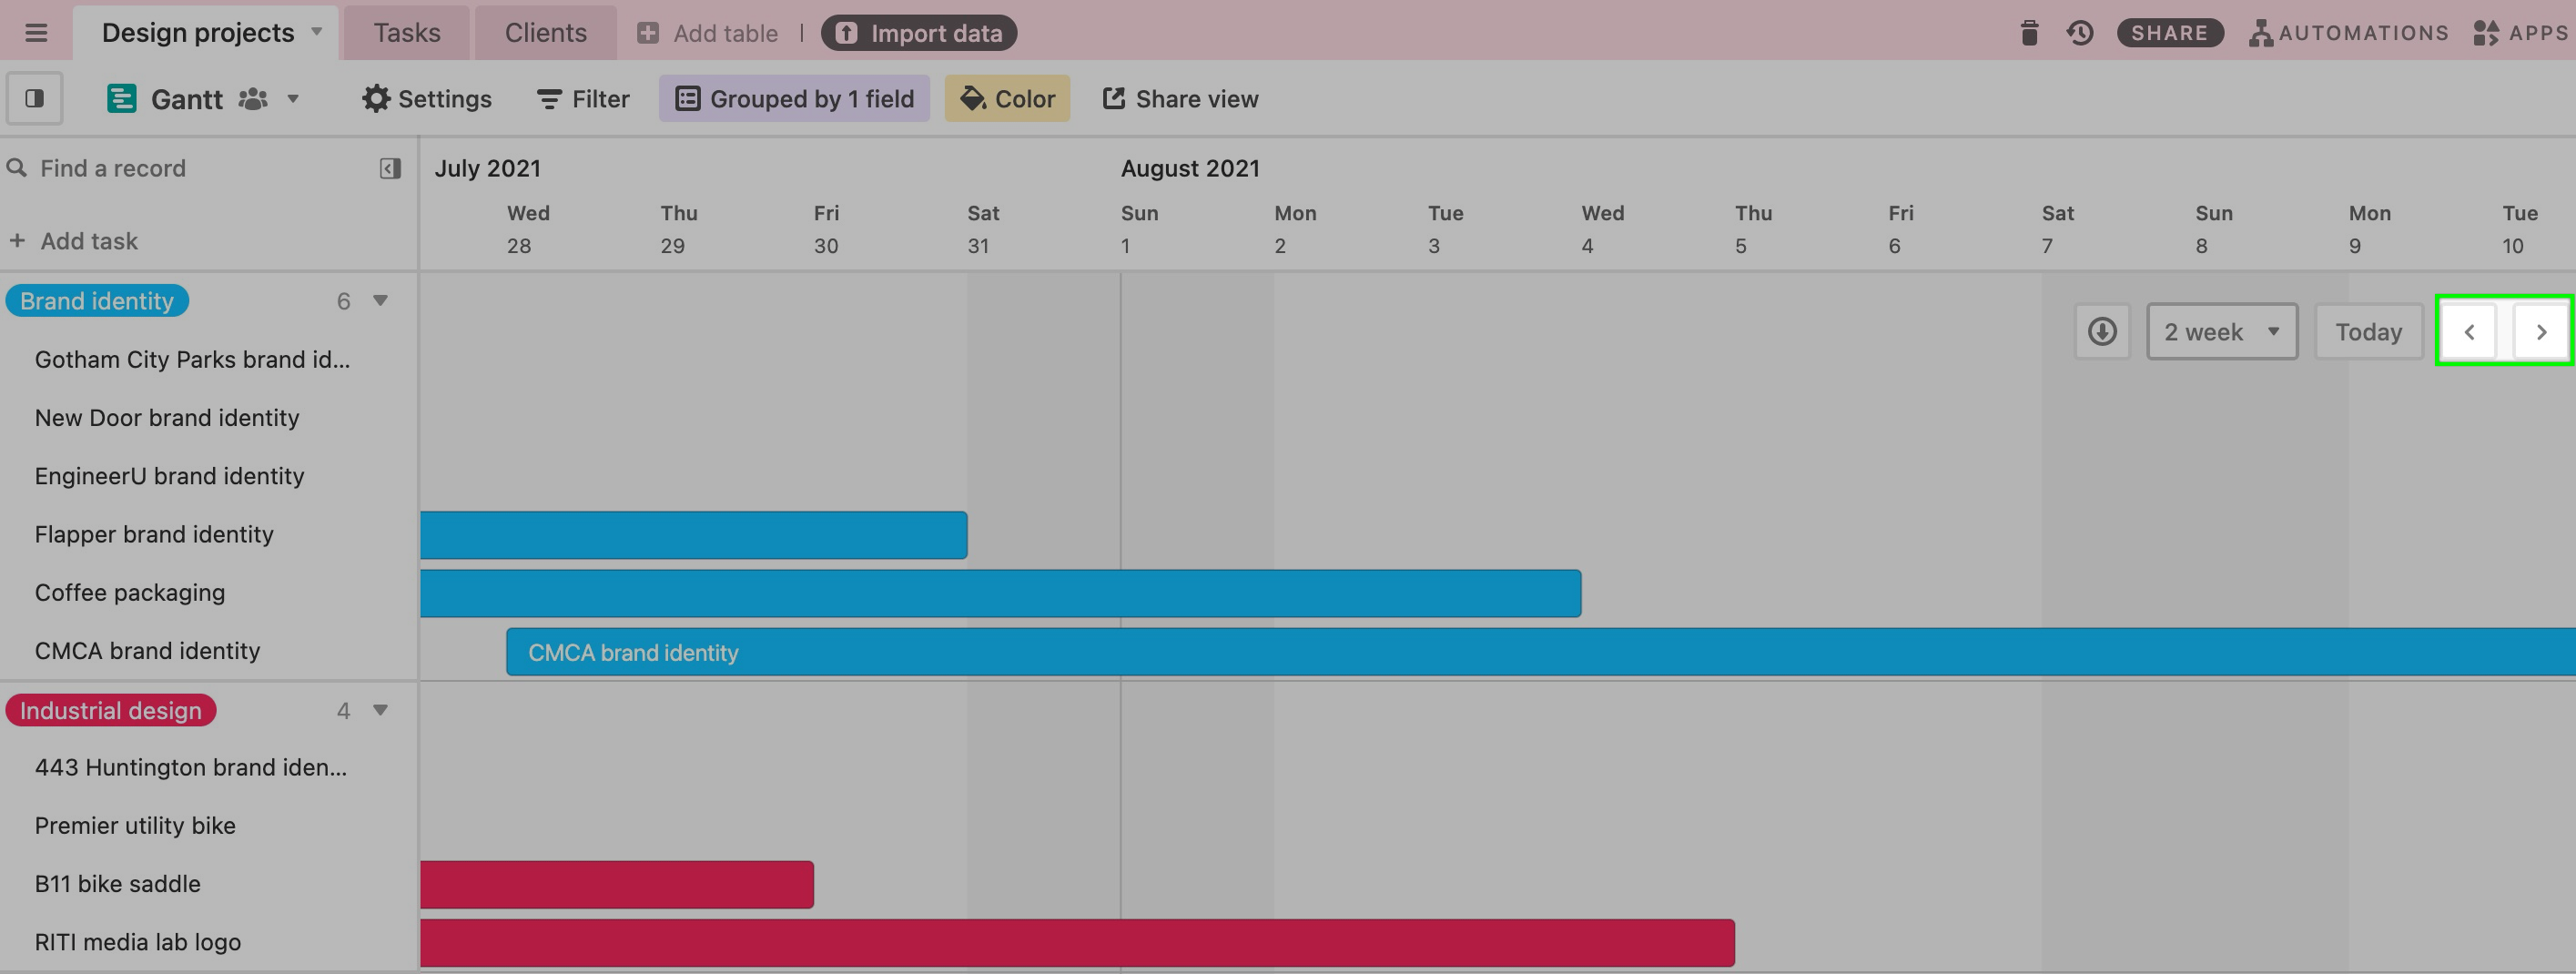
By clicking either forward or backward, the chart will jump to the next date range that you've already selected in the zoom menu. For example, if you're viewing records at the "Monthly" level, the view window will scroll to the next/previous month when clicking the arrows.
Resizing the sidebar
For records with long names, it may help to resize the left hand sidebar to see the full name. This setting is local to each user’s browser and is persisted across sessions. This sidebar width is also respected when exporting Gantt to PDF.