Plan availability | All plan types |
Permissions |
|
Platform(s) | Web/Browser, Mac app, Windows app, and some basic functionality on iOS and Android mobile apps |
Grouping records in Airtable overview
Grouping records in Airtable allows creators to build a set of one or more conditions that will help to categorize the dataset that is being presented within a particular view. Common examples include grouping by:
Multiple conditions create deeper categorization by adding collapsible subgroups within each group of records. When combined with other options such as record filtering or sorting, this allows you to create hyper-specific organization and insight into the records contained within a set of data.
Note
Grouping is only available in Grid, Timeline, List, or Gantt views.
Creating a group in a view
To create a group in a view:
Open your Airtable home screen.
Navigate to your preferred base and view.
Click on the Group button located between the Filter and Sort buttons.
Select from the suggested fields or click See all fields to choose from all available fields.
Once you've selected the field you want to group by, groups will automatically be created based on the unique values in that field. New groups will similarly be added automatically whenever a new, unique value is entered in the designated field. You can also group your records by multiple fields by clicking the Add subgroup option. There is a maximum of 3 levels of grouping (1 main group and 2 subgroups).
More group configuration options
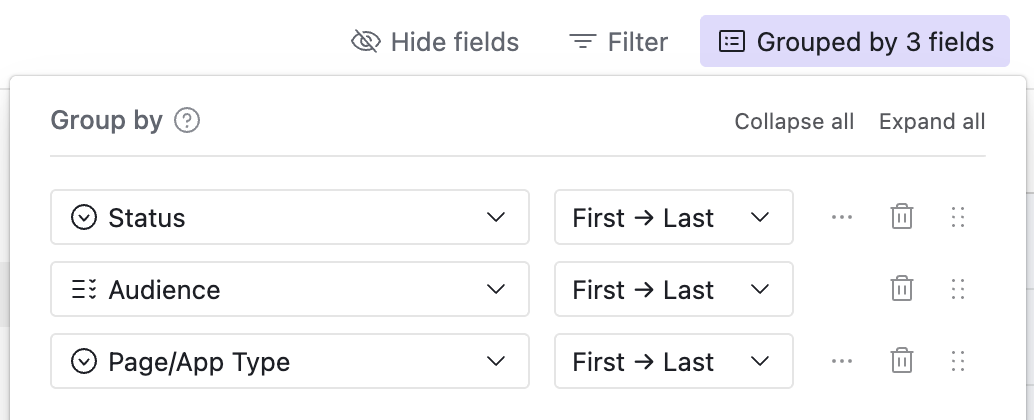
Additional group configuration options include the ability to:
Collapse or expand all of the groups in the view
Change the field referenced in the group or subgroup by selecting from the dropdown options
Change the sorting order of a group or subgroup by selecting from the dropdown options
Choose whether to show or hide groups with no records (Click the three dot icon and make your selection)
Delete a particular group or subgroup (Trash icon)
Drag a subgroup to move its order of grouping (Click the six dot icon and then drag and drop)
Dragging records between groups to reassign values
You can change the values on a record in a group by clicking and dragging the record to a different group using the drag handle on the left side of the record. For example, you could drag a task assigned to one person to another person's group, and that task would automatically be re-assigned to the new person.
Note
You cannot add new records to a grouping that is based on a computed field type (like a lookup, rollup, or formula field).
Understanding grouped summaries
There is a summary bar at the top of every group which can summarize the cell values in numerical fields by each group. These summary bars let you see the subtotals of each grouping. Every grouping will also have a count of the number of records in each grouping.
Much like the summary bar for the whole table, the summary bar for each group can provide different summary functions.
Grouping records within a date range
To group records within a date range:
If you want to group your records within a date range—for example, to see every transaction record that was made by week, or every deal by the quarter in which it occurred—you can create a formula field with DATETIME_FORMAT() and group on that formula field.
By using different format specifiers in your DATETIME_FORMAT() formula, you can group by day of the week, week of the year, month, quarter, and more.
Alternatively, instead of using the DATETIME_FORMAT(), you can also use the preset YEAR(), MONTH(), WEEKDAY(), or WEEKNUM() functions. You can read more about these functions in the formula field reference article.
Note
If you choose to group on a date field that includes a time field, you will group by both the date and time. If you aren't looking to include the time in your grouping, we recommend creating a separate formula field to parse just the date and grouping by that field instead.
Example 1: Grouping records by week
Let's say that you have a table of sales conversations, and you want to be able to group the outreach records by week in order to get a sense of how much outreach you've done each week for the past few weeks.
If you try to group on the Date field, only conversations that occurred on the same day will get grouped together. To group on the week instead, you'll need to make a formula field using
DATETIME_FORMAT().DATETIME_FORMAT()requires you to specify a date field (which we already have) and a format specifier, which determines the output of the formula. You can find a full list of our supported format specifiers on this page.Since you want to group on the week of the year, and the format specifier for the week of the year is 'w', you write this formula:
DATETIME_FORMAT(Date,'w')Now, you can group on the newly created Week No. field to see all the outreach events grouped by the week in which they happened.
Example 2: Grouping records by year and quarter
Let's suppose that you have a table of closed deals spanning multiple years, and you want to have some way to see the total size of the deals made by quarter and year.
To create a DATETIME_FORMAT() formula field that groups on quarter, use this formula:
DATETIME_FORMAT(Date,'Q')However, if you just group on this new field, records from different years (but the same quarters) will get grouped together. The solution is to create a second formula field for the year:
DATETIME_FORMAT(Date,'YYYY')If you create two layers of grouping (first grouping on Year, then grouping on Quarter), you can take advantage of the grouped record summary bar to get valuable data insights.
Using grouped records to create record reports
You can use the grouped records feature to create reports in Airtable. For example, suppose you have a sales pipeline in Airtable. If you use the group records feature, you can group by which sales opportunities closed successfully, by lead type, or any number of other criteria (depending on what your table looks like).
When the records are grouped, the summary bar shows separate summaries for each of the groups and sub-groups. You can pick from a variety of different possible summary functions (e.g. median, range, standard deviation) depending on the type of field.
In our example, the summary bar shows us the total number of successfully closed deals, the average amount of those closed deals in dollars, the earliest date of last contact for closed deals, and the median number of licenses sold in each successfully closed deal.
These summary functions will show for all of the different groups of records, so you can compare and contrast between groups. Looks like we failed to close some pretty big deals...
You can drill down even further by adding another grouping.
For many reports, grouping on a date range is particularly useful. For example, if you want to group records by the month, year, or quarter in which they occurred. If you're interested in learning more about groups based on a time range, then consult the section above.